Buildings, Carbon Neutral, Circular Economy, Construction, Embodied Carbon, Net Zero Carbon, Sustainability
COP26 House – An Embodied Carbon Exemplar
Nov
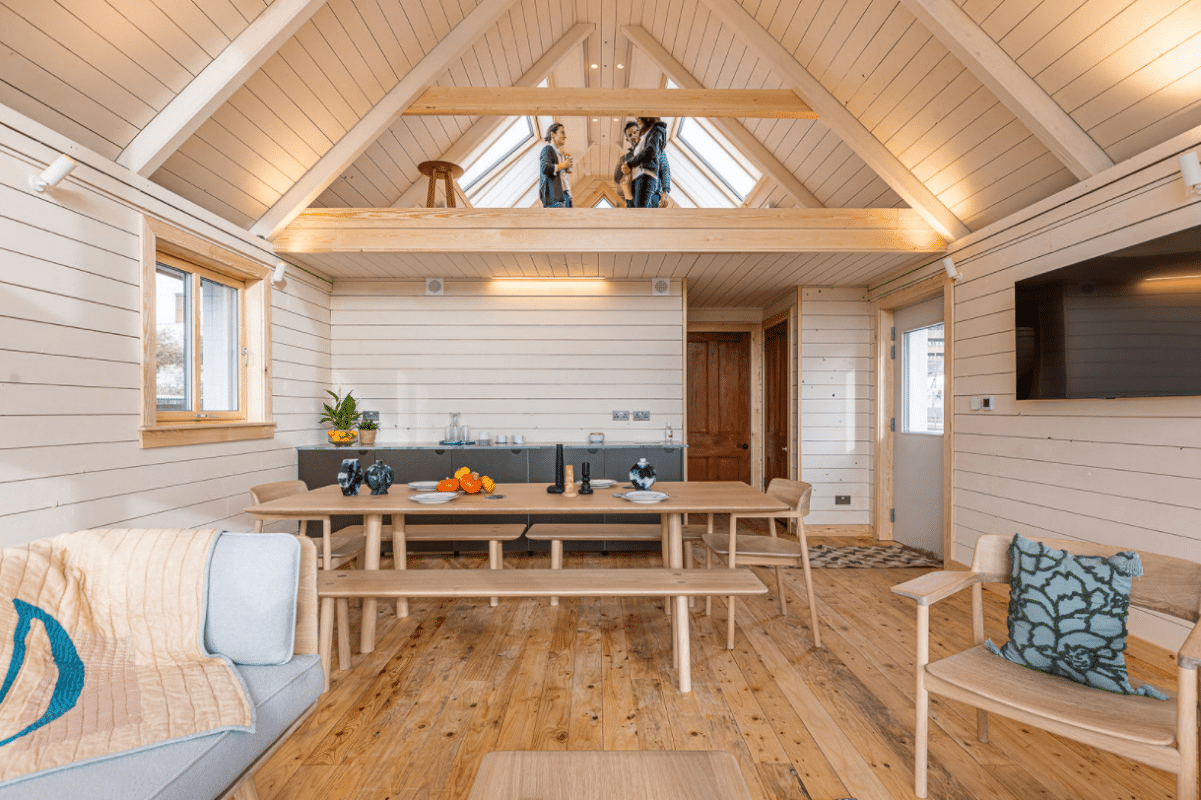
From its inception, a key aim of the COP26 House project from Beyond Zero Homes, was to minimise embodied carbon emissions. Most embodied carbon emissions come from the supply chain of construction products – the extraction of raw materials, processing, transporting and manufacturing. Further embodied carbon emissions come from transporting products to site, installation, repair and replacement during use, and their end-of-life deconstruction and disposal.
To minimise embodied carbon, the architect of the COP26 House, Peter Smith from Roderick James Architects, focused on efficient use of products and choosing those with lower embodied carbon. Wherever possible, Peter used timber-based products – because they generally have lower embodied carbon.
To put some numbers to this, Circular Ecology carried out a whole life embodied carbon assessment of the COP26 House. This article presents the results as well as a video and 360 degree tour by Fourfifteen, that can be viewed at the bottom of the page.
RIBA 2030 Challenge – Embodied Carbon Targets
The success of Peter’s design approach can be demonstrated by comparing the embodied carbon of the COP26 House with RIBA’s recently updated 2030 Challenge targets. As shown in Figure 1, a house the same size as the COP26 House built according to RIBA’s ‘business as usual’ benchmark would cause around 78,000 kg of embodied carbon emissions. To achieve the RIBA’s 2025 or 2030 targets, emissions would need to be reduced to around 50,000kg and 41,000kg of embodied carbon, respectively.
In fact, the COP26 House, thanks to the careful consideration of embodied carbon during its design, achieves around 32,000 kg of embodied carbon – that represents a 59% reduction compared with business as usual, and an impressive 22% reduction compared with the most stringent 2030 target.
As mentioned above, embodied carbon emissions occur throughout the life cycle and the RIBA 2030 Challenge targets and results in Figure 1 take all significant life cycle emissions into account over the standard sixty-year life cycle ‘study period’ (although it’s expected that the design of the COP26 House will mean its actual life should be much longer). Figure 2 shows the percentage each life cycle stage contributes to the total over sixty years.
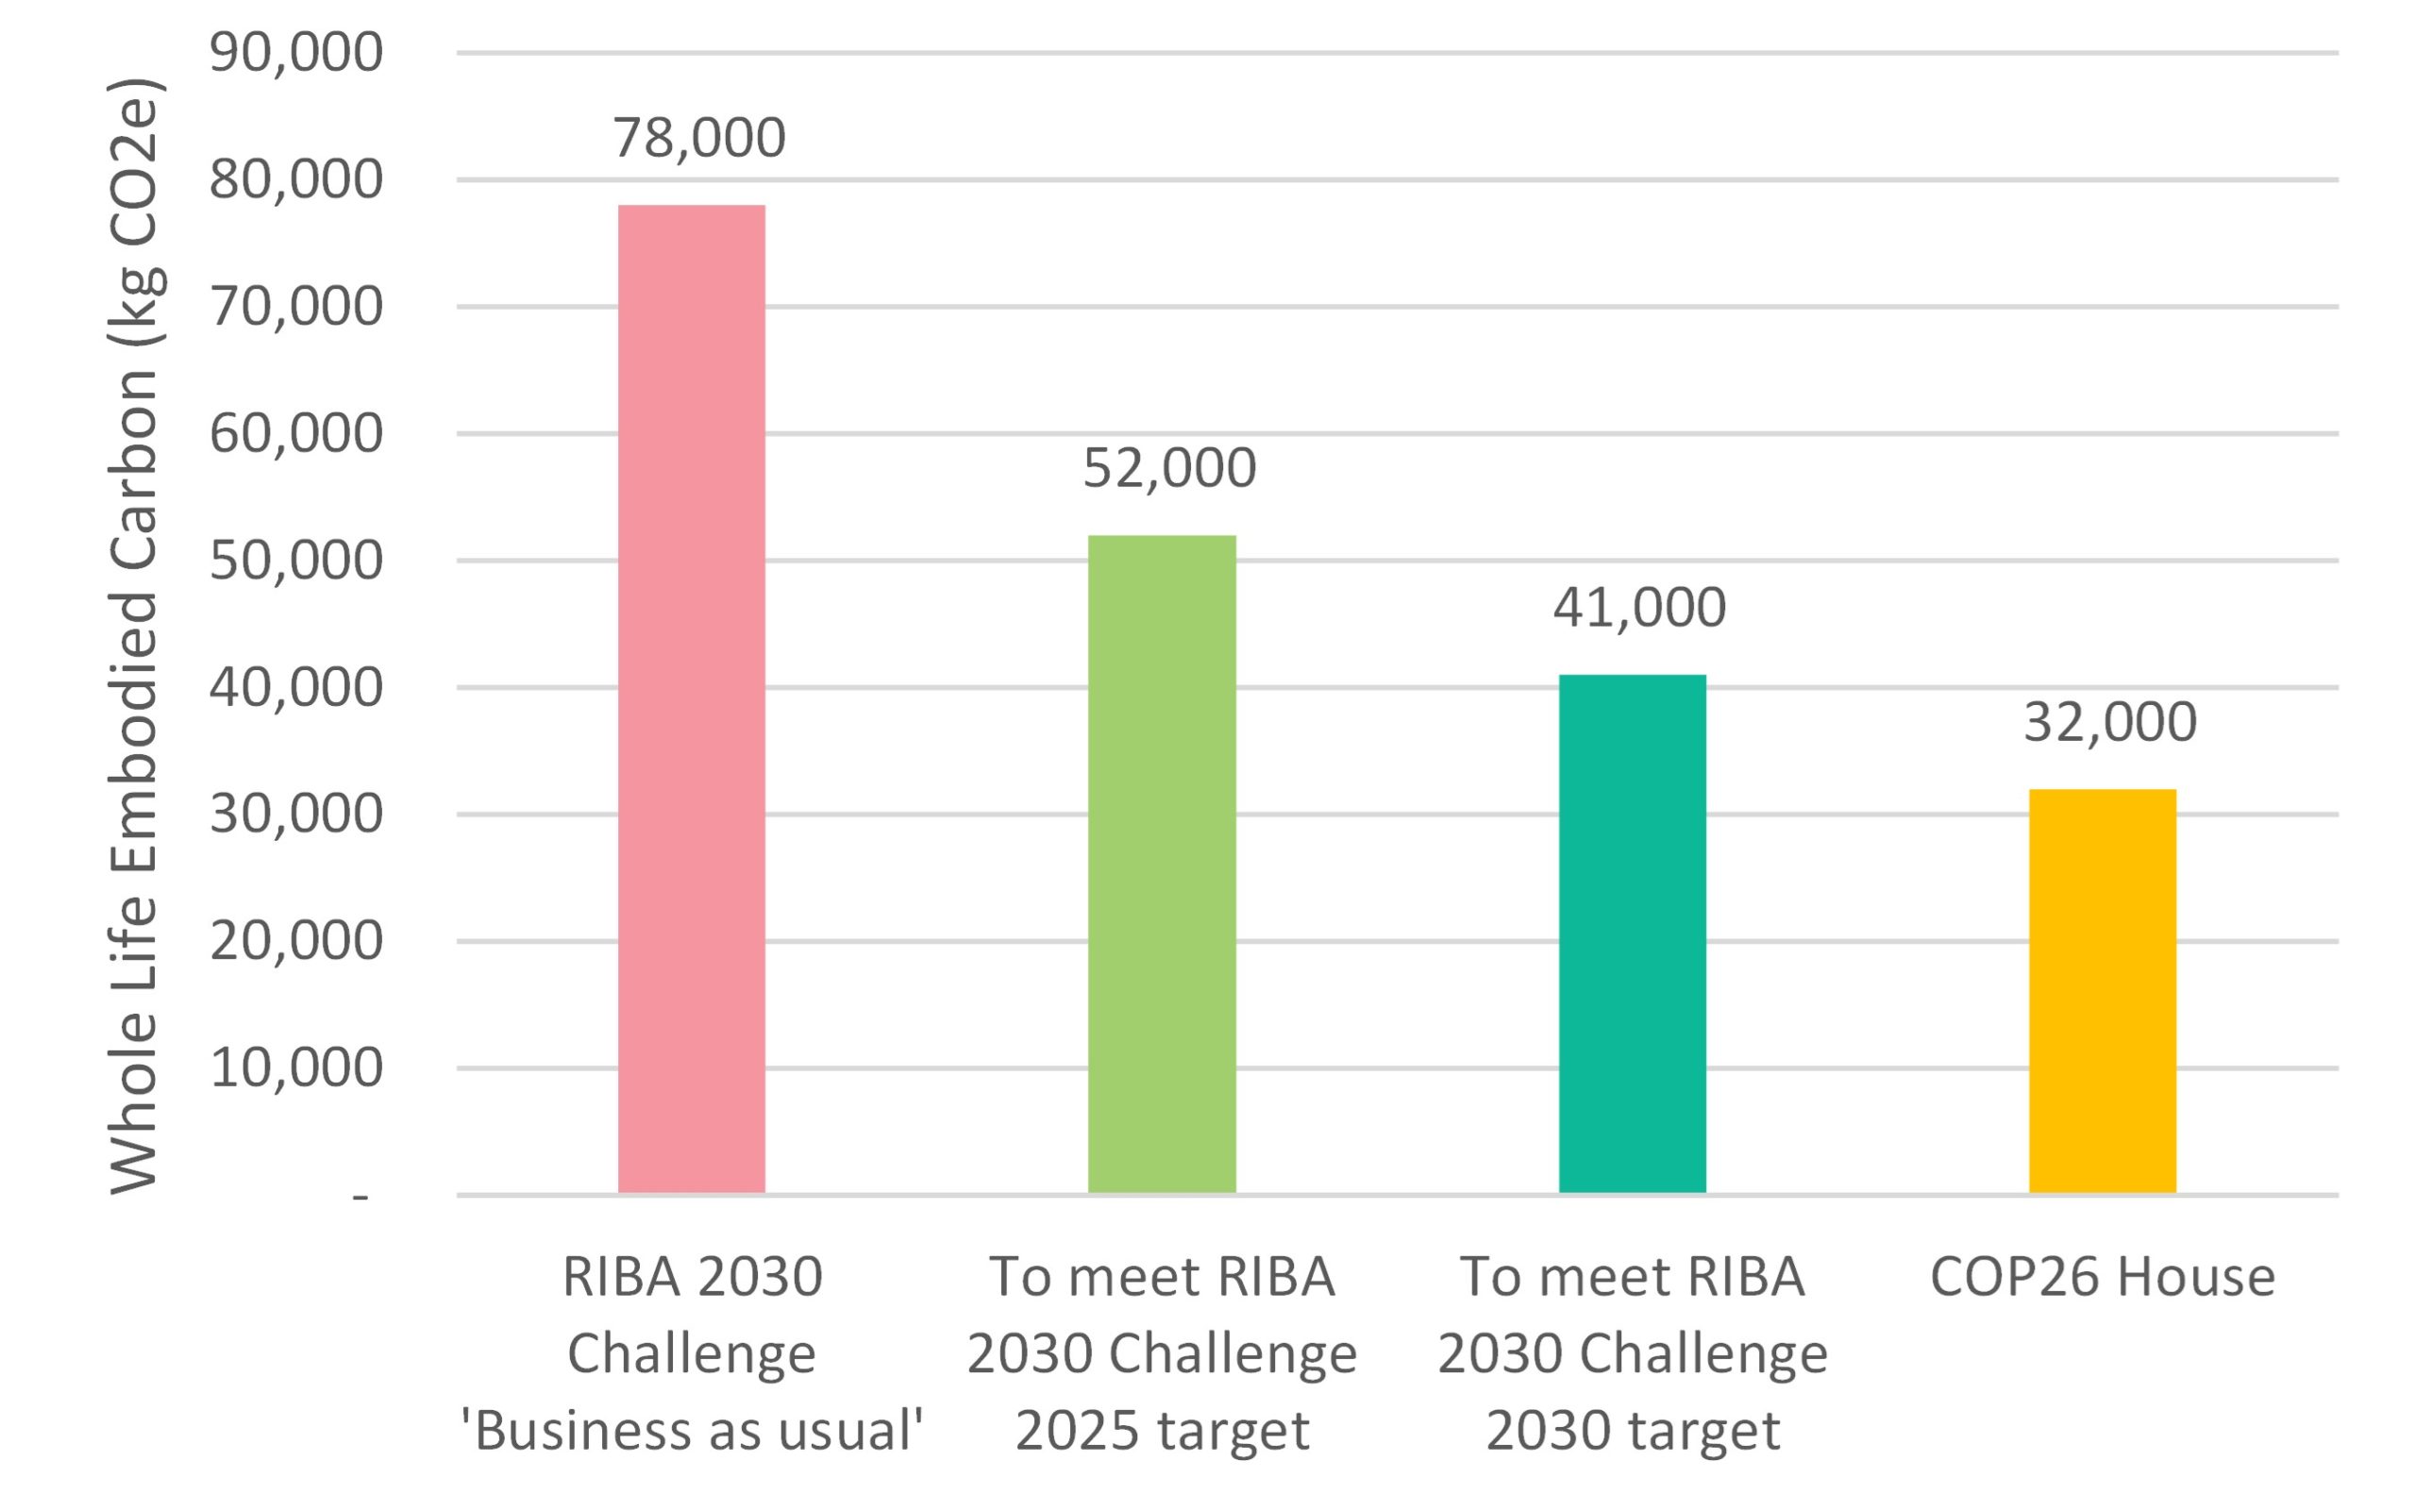
Figure 1
Comparison of the COP26 House with the RIBA 2030 Challenge Targets
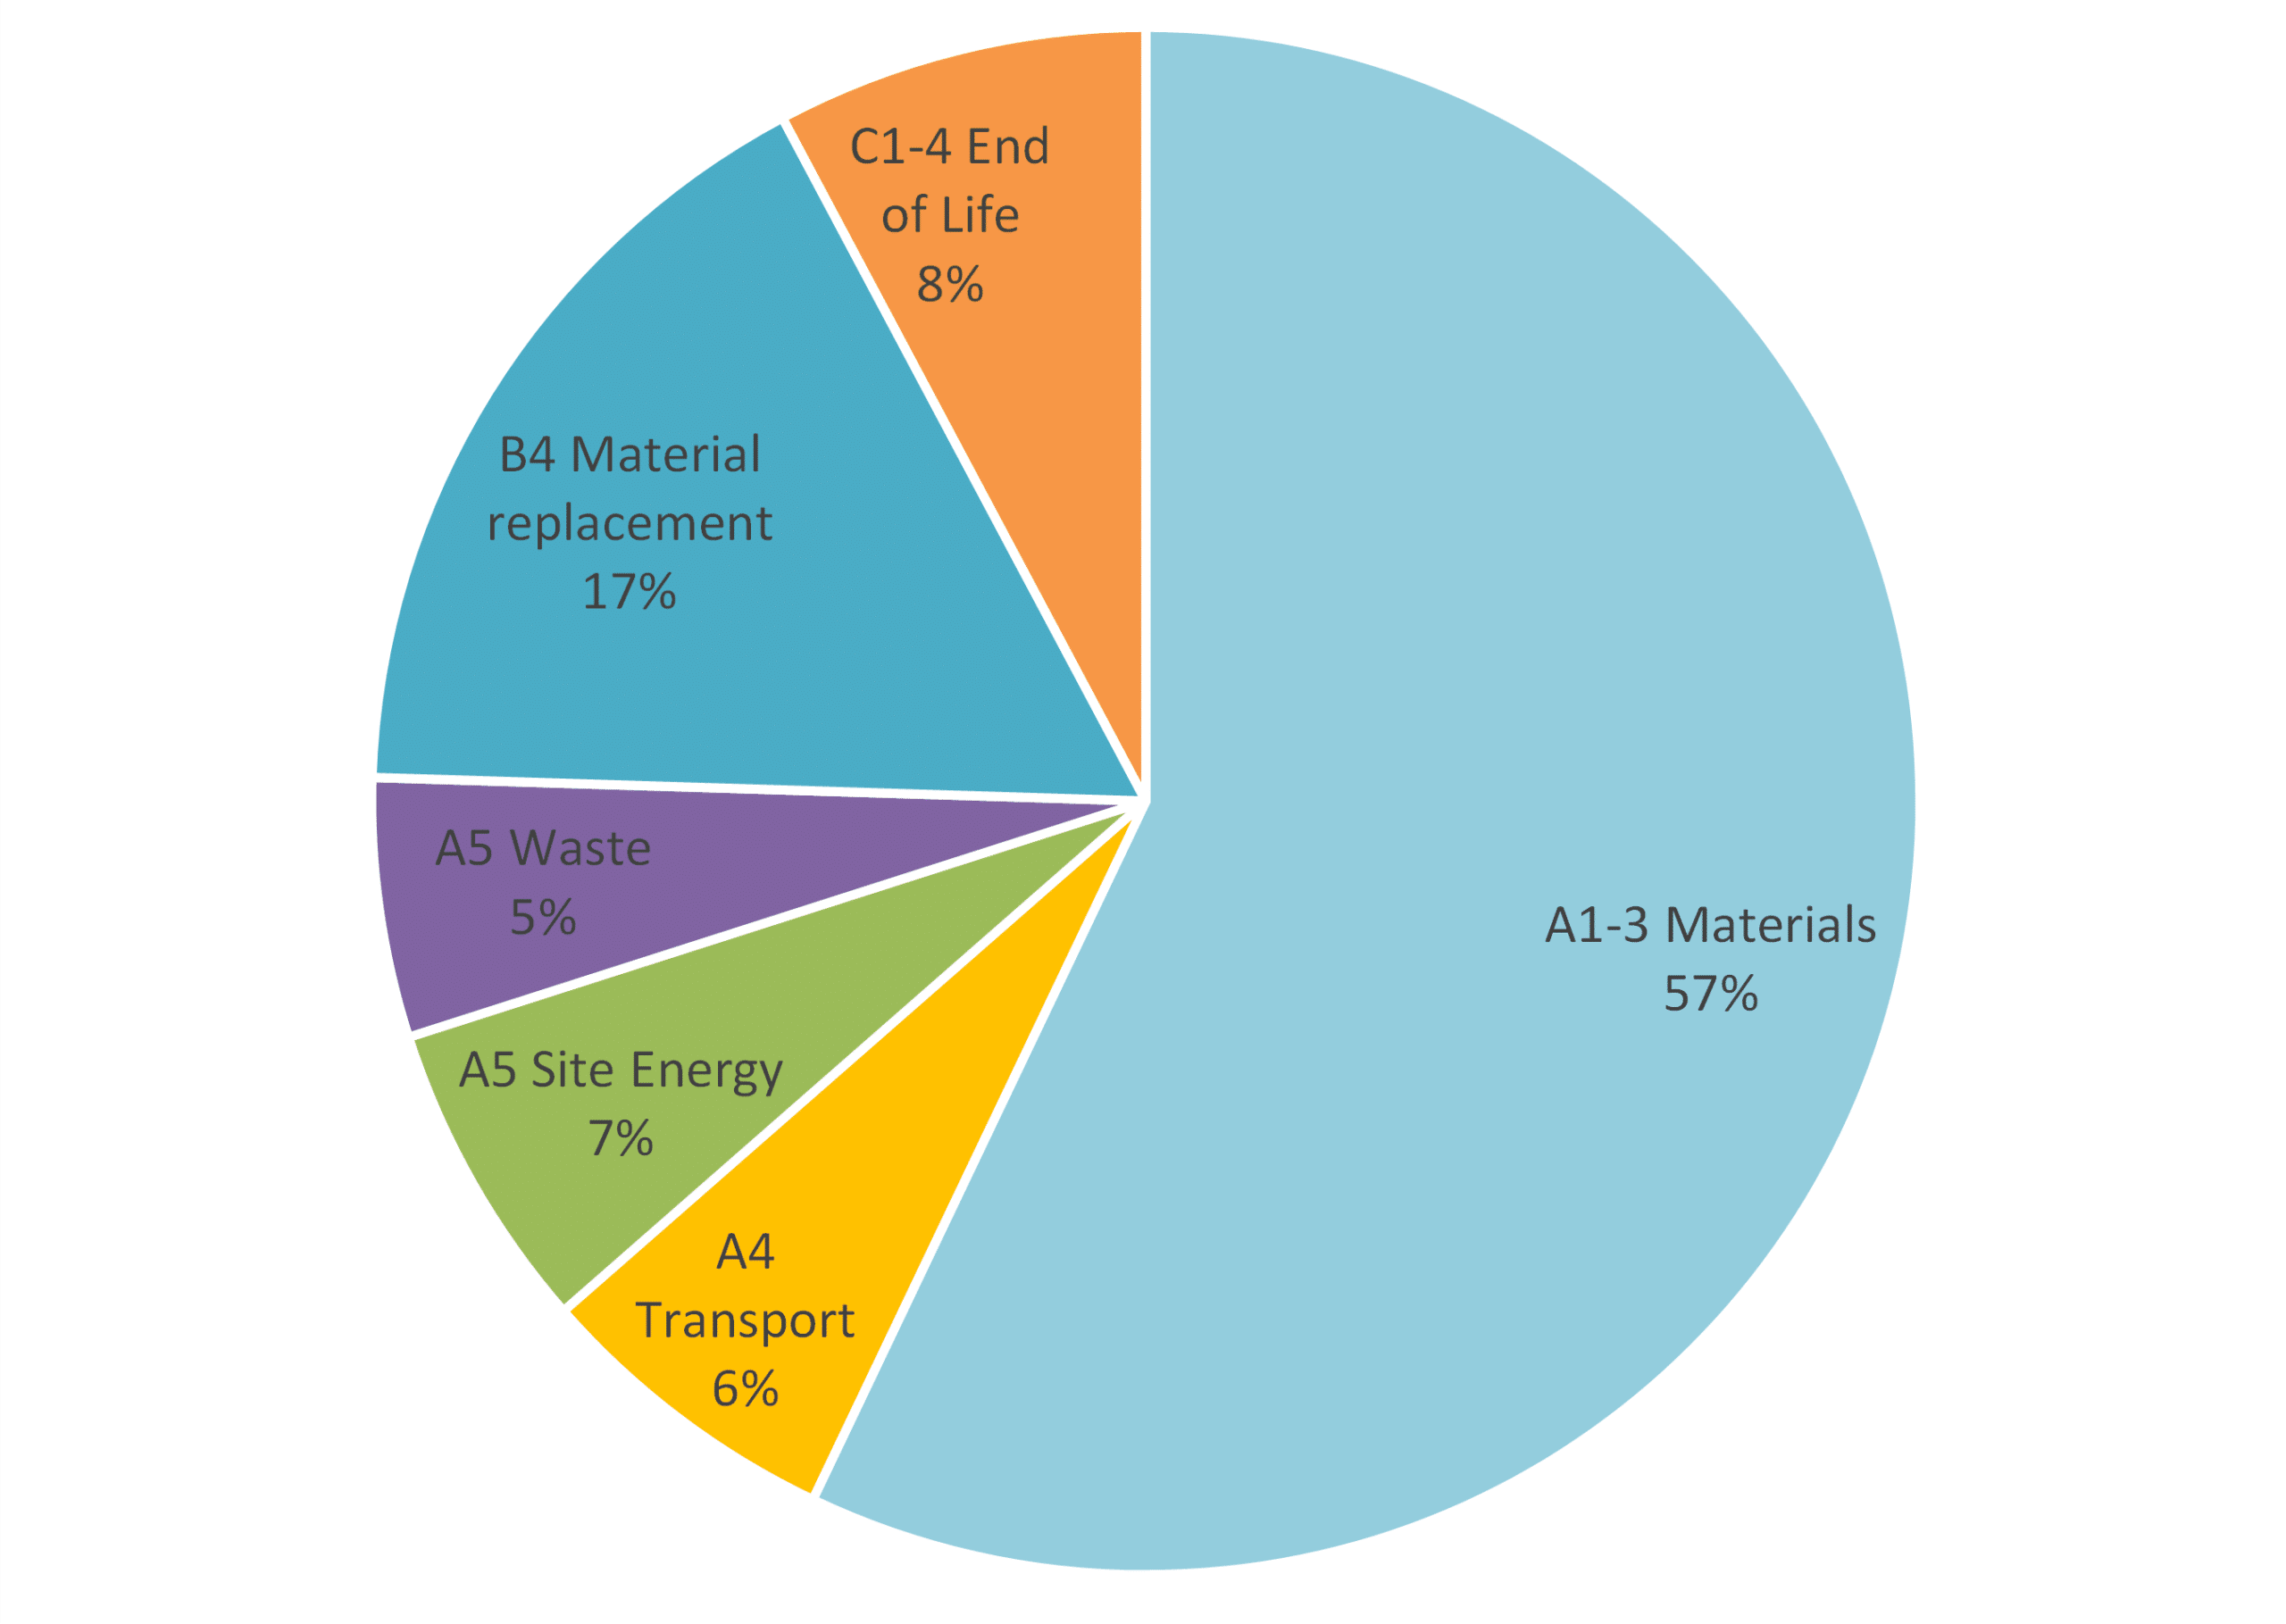
Figure 2
Embodied Carbon Breakdown by Life Cycle Stage
Maximising Biogenic Carbon Storage
Timber-based products generally have lower embodied carbon, but they have another important advantage – storing carbon from the atmosphere.
A growing tree absorbs carbon dioxide from the atmosphere and, as a result, stores carbon in its timber. When timber is harvested, this ‘biogenic carbon’ remains stored (known as ‘sequestered’) until the timber is broken down through incineration or decomposition.
Peter’s approach of maximising the use of timber-based products means a very significant amount of biogenic carbon has been stored. In fact, as shown in figure 3, the amount of carbon stored in the COP26 House far exceeds its upfront (up to practical completion) embodied carbon emissions. At practical completion, the COP26 House accounts for around 24,000 kg of embodied carbon but is, at the same time, storing more than double that at around 53,000 kg of biogenic carbon.
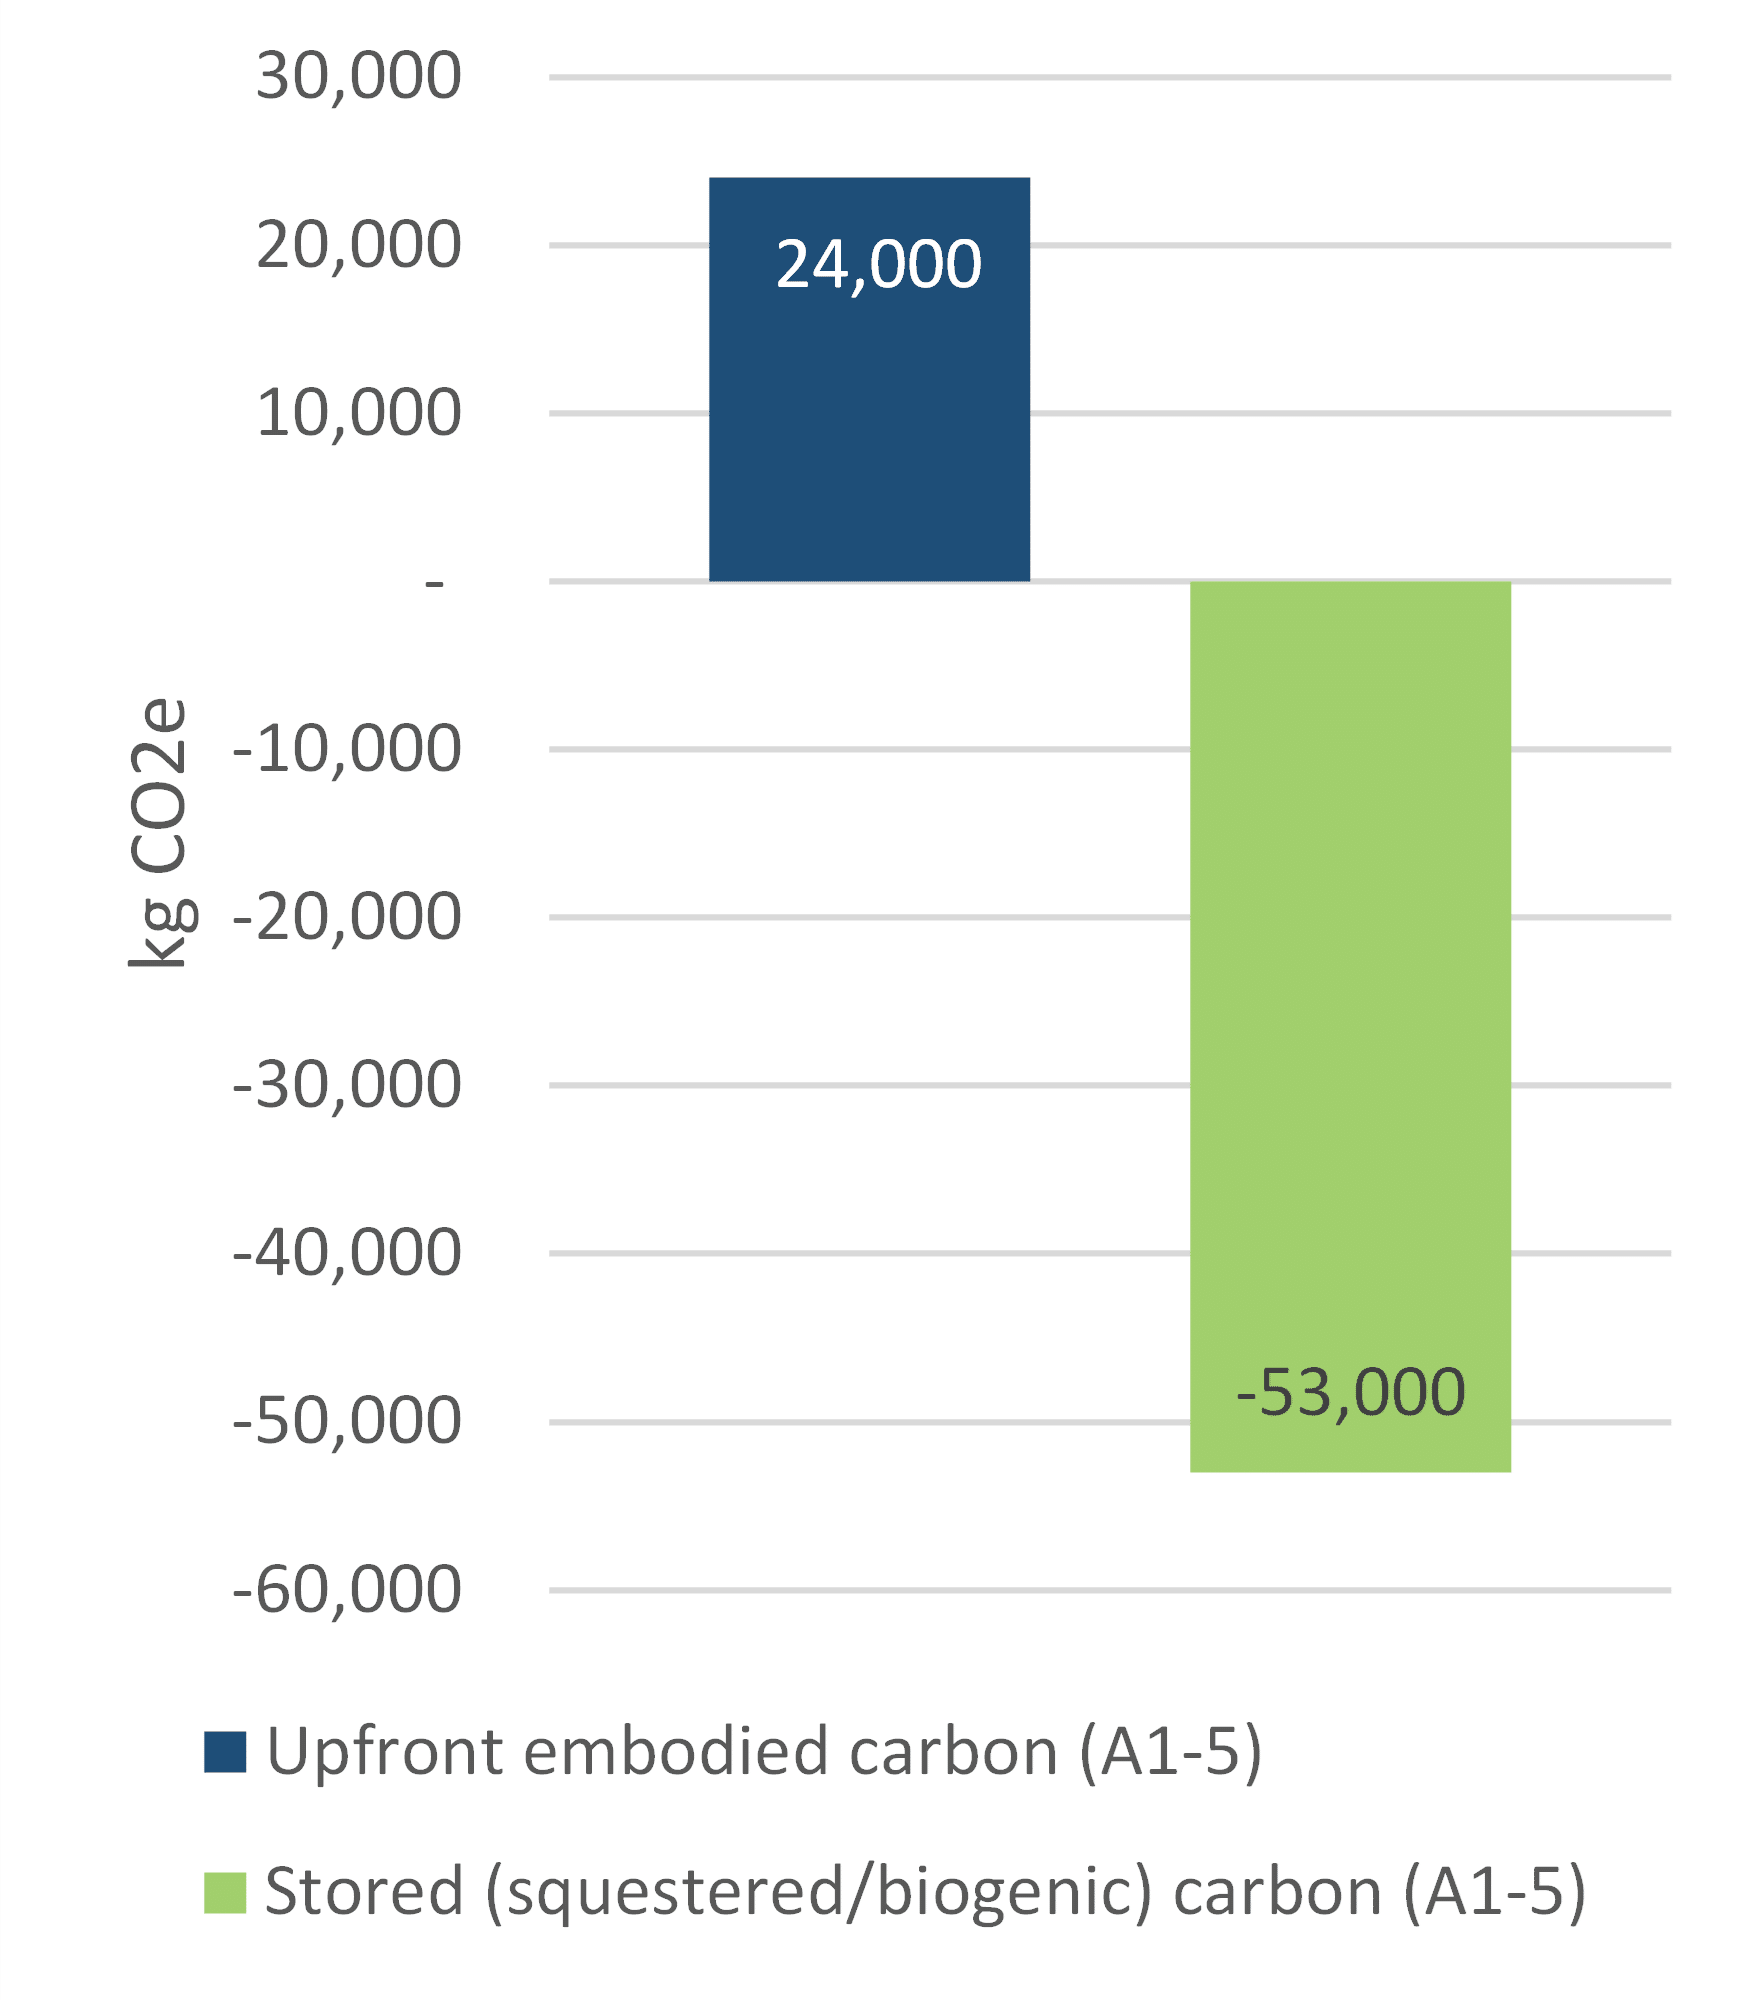
Figure 3
Upfront Embodied Carbon V Stored Carbon
This has been possible through clever use of timber-based products throughout the house. Many parts of the house that would normally use another type of product have used timber – even the roof covering on the COP26 House is timber! Figure 4 shows the percentage contribution each building element type makes to the embodied carbon total (positive values in dark blue) and stored biogenic carbon (negative values in green) total.
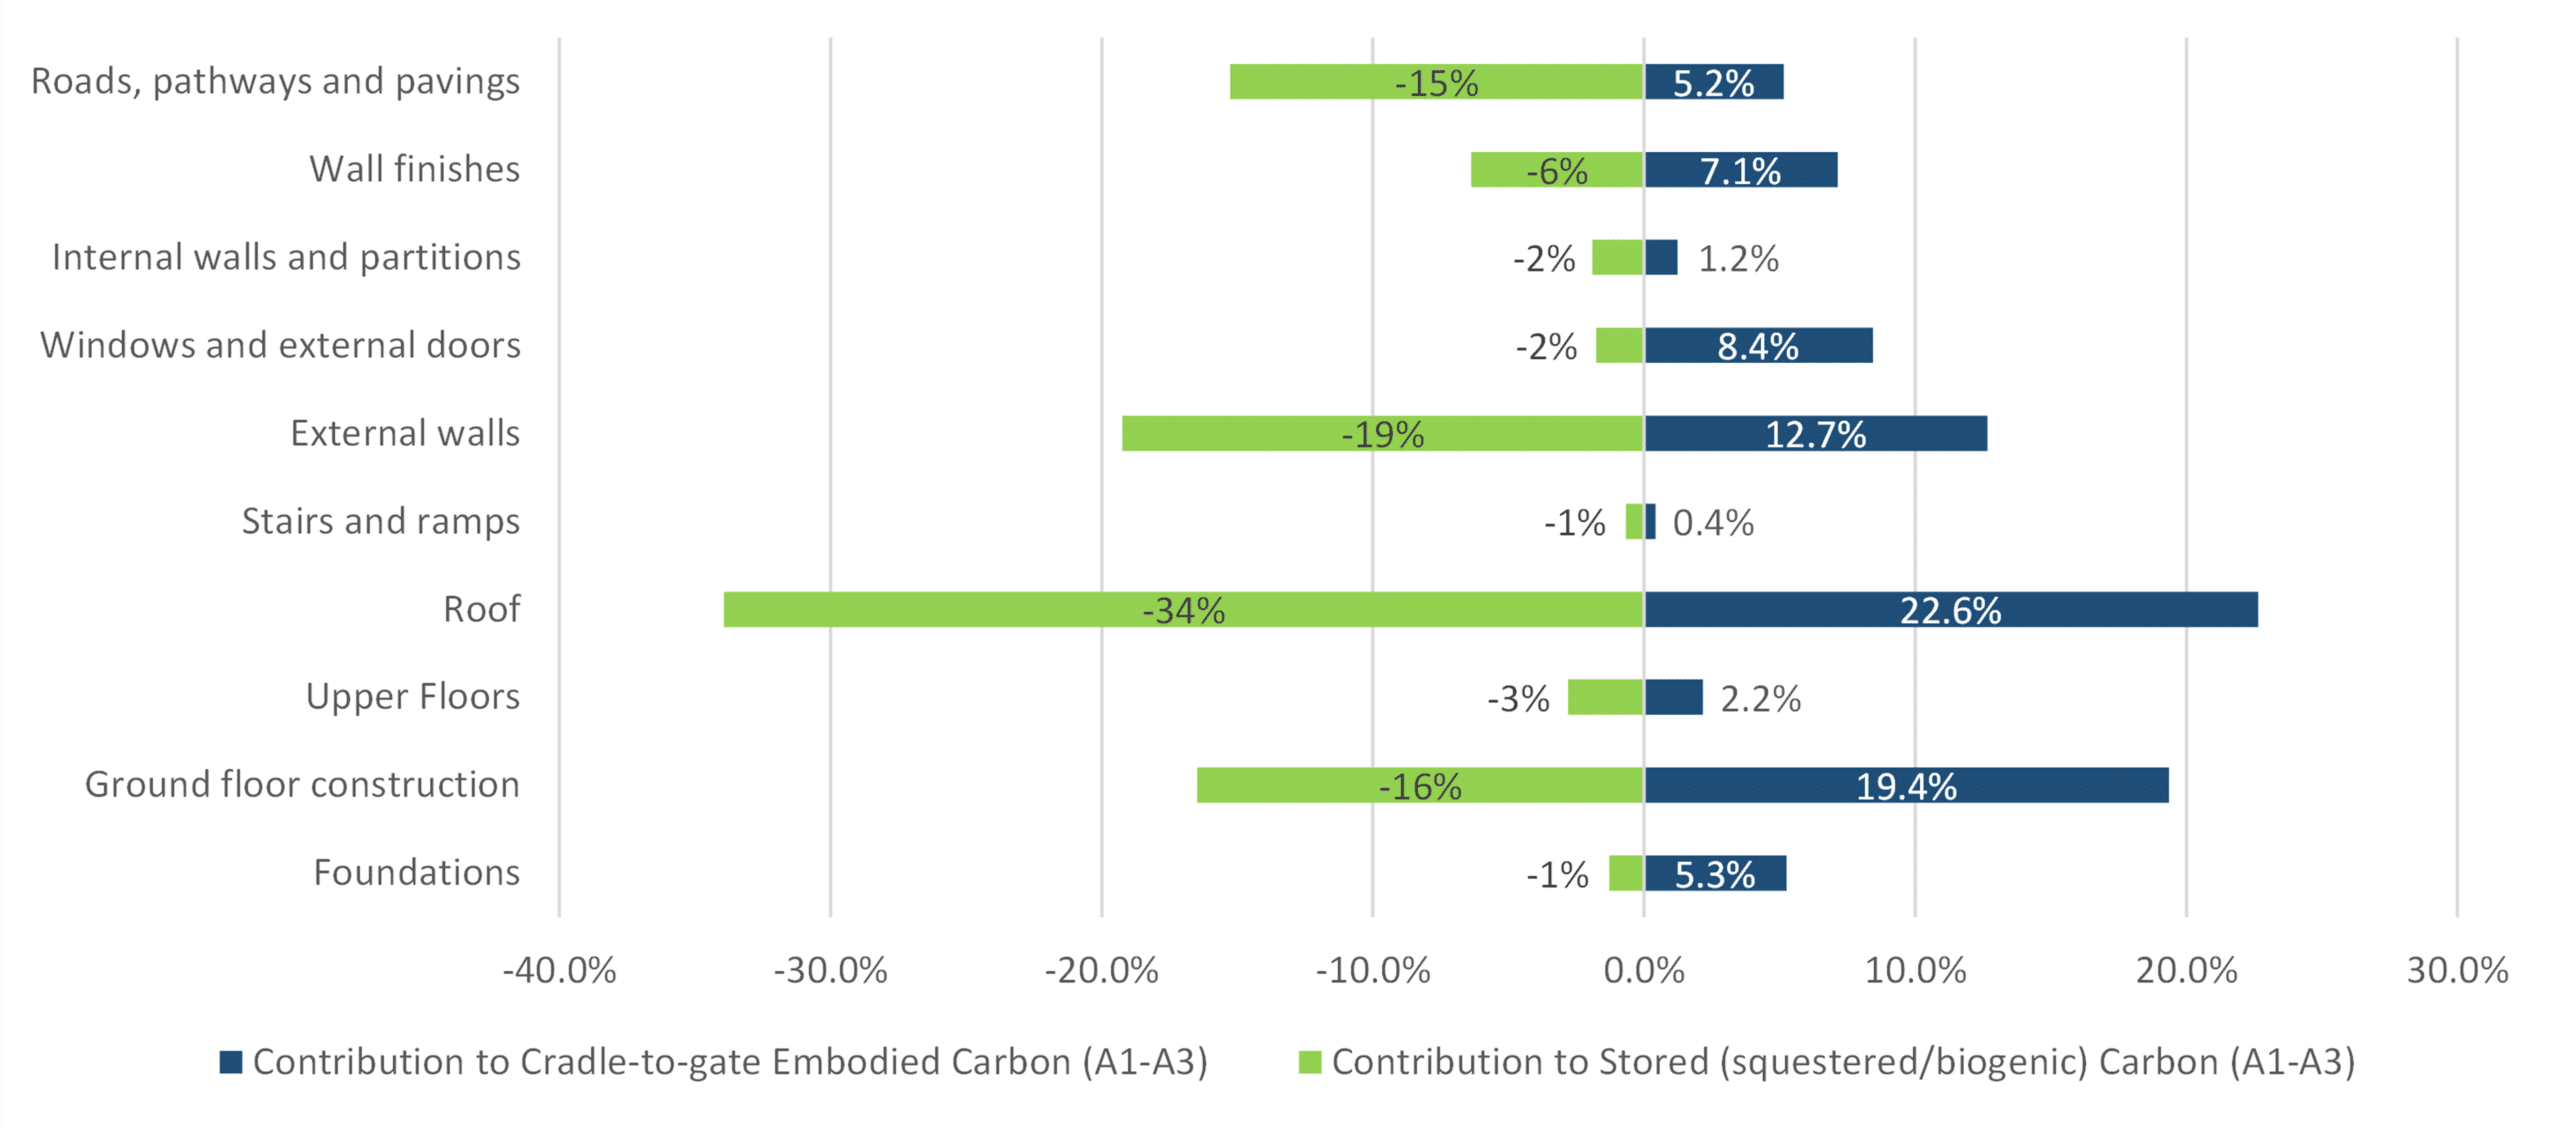
Figure 4
Stored Carbon Contribution – Breakdown by Element
For any building that stores biogenic carbon, this carbon is eventually destined to return to the atmosphere when the products are disposed of through incineration or decomposition. If this is delayed by timber products being re-used after the building is dismantled, the benefits of biogenic carbon are transferred to the next life. For this reason (confirmed by RIBA as in-line with their targets approach) stored biogenic carbon has not been considered in the whole life embodied carbon results shown in Figure 1.
However, to maximise the benefit of stored carbon, end of life disposal should be delayed for as long as possible by designing for resilience and simple future re-use. The COP26 House has been designed with resilience in mind, so its life should far exceed the standard sixty-year study period. In addition, care has been taken to use standard components that are easily dismantled so they can be simply re-used in a future building.
Achieving Low Whole Life Carbon
Achieving a whole life embodied carbon result that is well below the most stringent RIBA 2030 Challenge target, as well as storing more than twice the carbon that is emitted at the point of practical completion, means the COP26 House can be considered an exemplar in low embodied carbon design.
You can read more about Circular Ecology’s involvement in the COP26 House as a member of Beyond Zero Homes here. You can also see more of the house in the video below or take a 360 degree tour both made by Fourfifteen.
If you are interested in measuring and managing the embodied carbon of your construction projects, please don’t hesitate to contact us
Gallery - Designed with Circular Economy Principles
View further gallery photos from Fourfifteen
Hi, thanks for this – we know how much effort it takes to get these numbers out!
What’s the GIFA and are you sure you should have included roads and pathways in the calculation for RIBA 2030 (just for consistency of reporting, of course)?
Thanks in advance!