Scope 3 Carbon Footprint

In most cases, Scope 3 emissions constitute the largest share of an organisation’s carbon footprint. According to CDP, supply chain emissions can be 11.4 times higher than an organisation’s operational emissions on average. However, calculating emissions relating to your supply chain can often be a complicated, time intensive process, and as a result it can be hard to decide where to start.

Scope 3 emissions occur from sources right across the entirety of an organisation’s value chain, therefore covering activities that are not owned or controlled by the organisation itself. This lack of direct control and oversight can make it more difficult to gather the information and data required.

Where to start with a Scope 3 Carbon Footprint

A major obstacle for many organisations trying to calculate their Scope 3 emissions can be the lack of information readily available, both when choosing the most appropriate activities for the organisation to tackle first, and also when gathering the data required in order to calculate Scope 3 footprints themselves.

It is highly recommended to break down this process into smaller, more manageable steps, by first identifying the most relevant areas based on impacts and/or importance to the business, before further developing more detailed footprint calculations for the most critical Scope 3 categories.

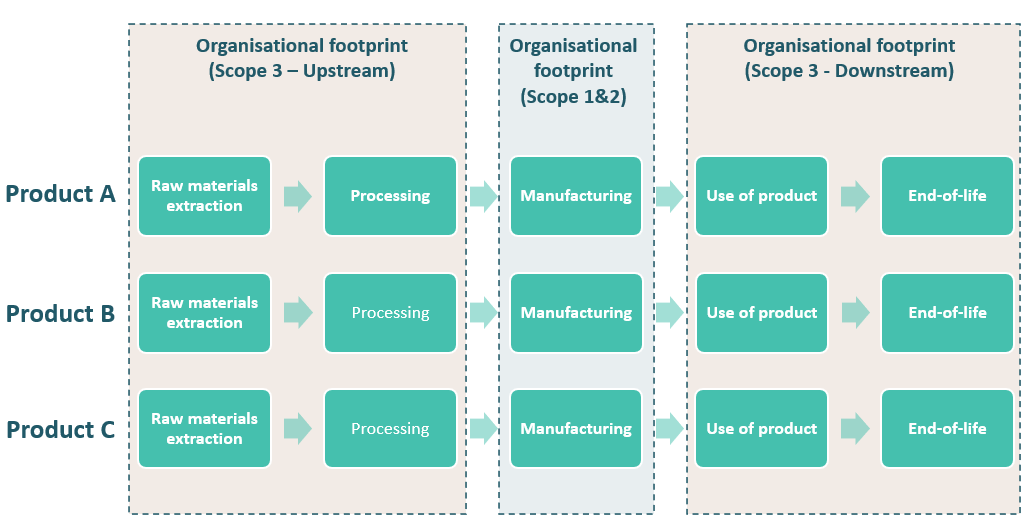
Following GHG Protocols Corporate Value Chain (Scope 3) Standard, Scope 3 emissions are classified under 15 categories, usually deemed to be either “upstream” or “downstream” of the organisation’s own operational activities.

The process below shows the typical approach Circular Ecology takes when developing Scope 3 carbon footprints:

Scope 3 development process
  1. Scope 3 screening process – High-level screening and materiality assessment across all 15 x Scope 3 categories.
  1. Scope 3 data source selection – Review of most appropriate primary & secondary data sources for all significant Scope 3 categories.
  1. Scope 3 data collection & gap identification – Support with supply chain engagement to facilitate the collection of all relevant primary & secondary data.
  1. Scope 3 footprinting & data quality review – Calculation of Scope 3 carbon footprint and review of data quality to establish priority areas for further supply chain engagement and to support the identification of carbon reduction opportunities.

By adopting this approach, an organisation can quickly establish a high-level view of its Scope 3 emission hotspots, which will then allow it prioritise longer-term development of carbon footprints for the most relevant Scope 3 categories, and free up more time and resource to pursue productive supply chain engagement opportunities.

Organisational Footprint vs. Product Footprint

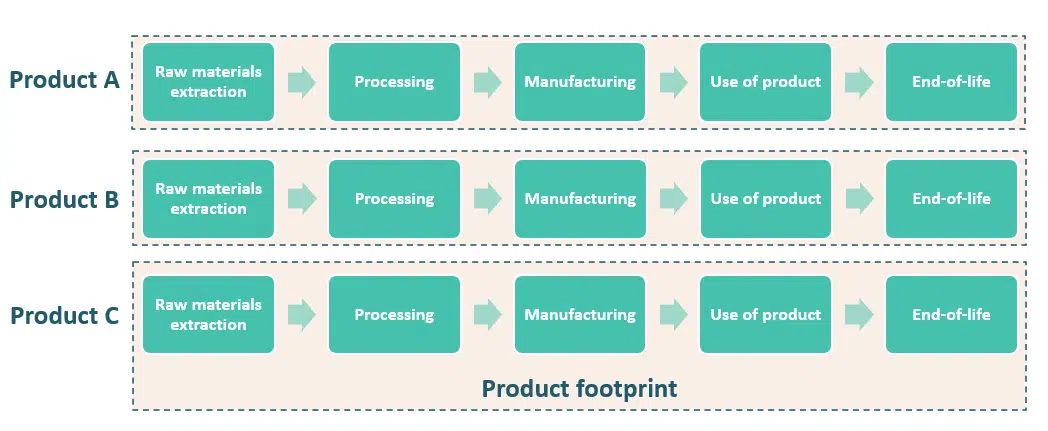
For manufacturing companies, it can also be useful to consider undertaking Product Carbon Footprints or Lifecycle Assessments (LCAs) in order to assess the full (Cradle to Grave) or partial (Cradle to Gate) carbon lifecycle of a specific product, which can help with the further quantification and improvement of the organisation’s Scope 3 emissions inventory.

A product footprint considers the full lifecycle carbon specific to a particular product or output. An organisation may undertake multiple product footprints in order to compare the carbon impacts across their range of outputs.

This process allows an organisation to understand the particular carbon hotspots of a specified product. Over time this information can be used to incentivise improvements in production processes, which can provide longer term economic benefits.

Product Carbon Footprint Boundaries

On the other hand, an organisational Scope 3 footprint considers the total emissions across all of the organisation’s activities (product & non-product related) under the relevant Scope 3 categories.

This approach allows for a more holistic view of the organisation’s carbon impacts relating to its upstream and downstream activities. This knowledge can subsequently be used to focus stakeholder engagement to areas which can provide the most significant benefits in the future.

Organisational Carbon Footprint Boundaries

Both types of assessment can be extremely valuable depending on the organisation’s objectives and requirements. Furthermore, efforts within either approach tend to be mutually beneficial with many crossovers between the two processes.


Please use the form below if you would like to reach out to us regarding these services.

Have a Very Green Christmas

For many people, Christmas is a time of joy and celebration, for sharing gifts and [...]

ICE v4.0 Launch: Webinar Recap

Circular Ecology successfully hosted a webinar on November the 28th, providing details on the launch [...]

Launch Webinar: Inventory of Carbon & Energy (ICE) Database v4.0

Circular Ecology would like to invite you to a webinar on the 28th of November, [...]

ICE Status Update: Webinar Recap

Circular Ecology successfully hosted a webinar on Sept 26th, providing a Status Update on the [...]