Scope 3 Footprint: Beyond Spend Based Data
For many organisations, undertaking a spend based Scope 3 assessment is the natural starting point for benchmarking and gaining a high level understanding of their value chain emissions. This approach provides the quickest route to assess the materiality of all Scope 3 categories and determine where emissions hotspots are most likely to occur. However, a spend based approach is inherently limited: prices are not a reliable proxy for carbon, results can be volatile year on year, and the outputs offer limited insight into where and how actual emissions can realistically be reduced.
Improving underlying Scope 3 data, therefore, should be based on a gradual replacement of spend based methods with a process based approach, following a structured, iterative journey towards better quality and more actionable data sources.
How to Improve Scope 3 Data
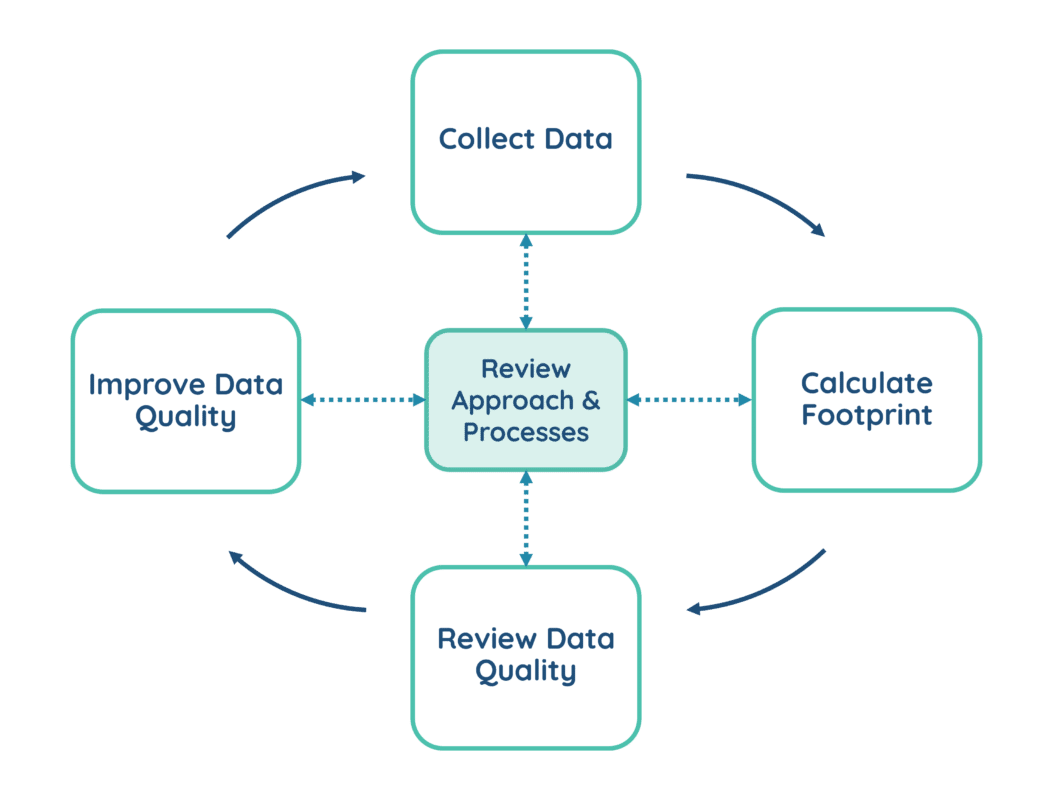
There are a few simple steps that any organisation can follow when improving its Scope 3 data, following an initial spend based assessment.
- Review: Perform a ‘sense check’ of the previous assessment and identify your significant emissions
- Selection: Map your most significant categories and activities that could potentially be replaced with better ‘process based’ data
- Collection: Collect the best available process based data you have already to replace spend for significant categories
- Gap Analysis: Were you able to get the data you wanted? Note any lessons learned at each stage to help improve the process for next time
Activity Data Selection
Once carbon hotspots have been identified, the next step is to look at the best available activity data rather than spend data alone. This activity data can refer to information that more directly describes what has happened in the value chain, such as quantities of materials purchased, distances travelled, freight modes used, waste generated, or employee travel patterns and behaviours.
For significant Scope 3 categories, organisations should take an inventory of the data they may already hold. This might include:
- Quantity Data – weights, volumes, material, POs or SKUs, etc.
- Transport Data – distances, freight routes, freight type, etc.
- Travel Data – locations, passengers, number of nights’ stay
- Waste Data – collection reports, weight and disposal method
- Employee Data – commuting or homeworking habits
In many cases, better data may already exist within procurement, finance, or operations teams, but may not have previously been used for carbon reporting.
The aim at this stage of the process is not to achieve perfection, but more to determine relevance. Even more generic activity data could provide a more stable and interpretable basis for future emissions calculations than just spend alone, particularly for any high impact categories.
Emissions Factor Selection
The improvement to any activity data must also be combined with the selection of appropriate emission factors. Emission factors should be chosen using a clear data quality hierarchy, prioritising relevance over simplicity. Factors should be assessed based on their geographic alignment, temporal relevance, technological representativeness, transparency, and completeness.
Spend based factors typically sit at the bottom of this hierarchy, followed next by generic process based factors, then more targeted proxy data, and ultimately supplier specific emissions information such as Environmental Product Declarations (EPDs) or verified carbon footprints. In practice, organisations can often use a mix of factor types across their Scope 3 inventory, with higher quality data applied to the most significant categories.
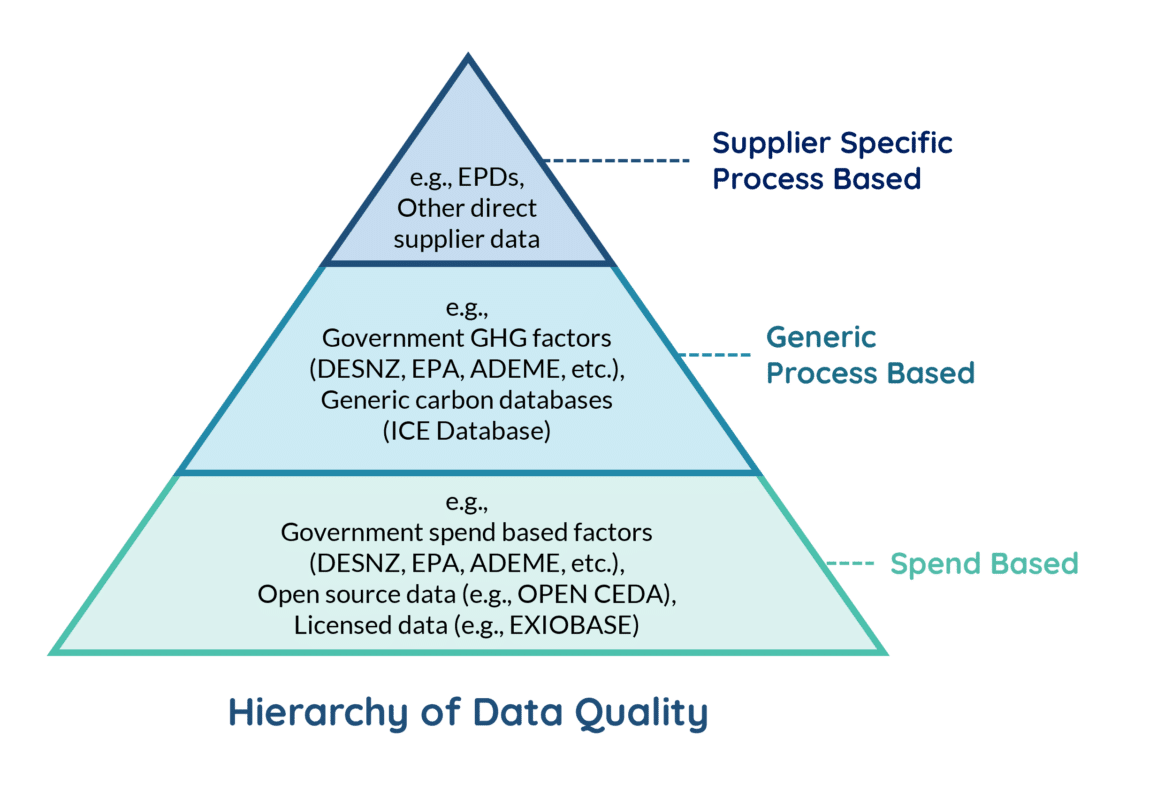
Using a simple data quality scoring approach can help make these decisions transparent and repeatable, particularly when tradeoffs are required between coverage and data quality.
Tracking Improvements
As your Scope 3 reporting matures over time, it becomes more important to track not just emissions totals, but also improvements in data quality itself. This is where Data Quality Indicators (DQIs) can play a useful role. DQIs allow organisations to monitor changes such as the proportion of emissions calculated using spend based data versus process based or supplier specific data, or the number of categories that have improved their underlying data quality over time.
Using a small number of Data Quality Indicators (DQIs), such as the ones below, can help track Scope 3 data quality over time and increase the focus on improvements.
- Footprint DQIs: Emissions % by data type (supplier specific, generic process based, or spend based). Target decrease in spend based share over time.
- Category DQIs: Significant emissions % moved away from spend based, or number of categories with improved DQI scores over time.
- Factor DQIs: You can score data quality of individual factors used for geographical, temporal and technological relevance and aggregate the DQI scores as needed.
Tracking data quality alongside emissions helps demonstrate the progress made on reporting, even where total emissions may rise or fall for reasons outside an organisation’s direct control, such as from changes in demand or supply chain structure. It also helps ensure efforts remain focused on reducing uncertainty in the most significant parts of the footprint.
Supplier Engagement
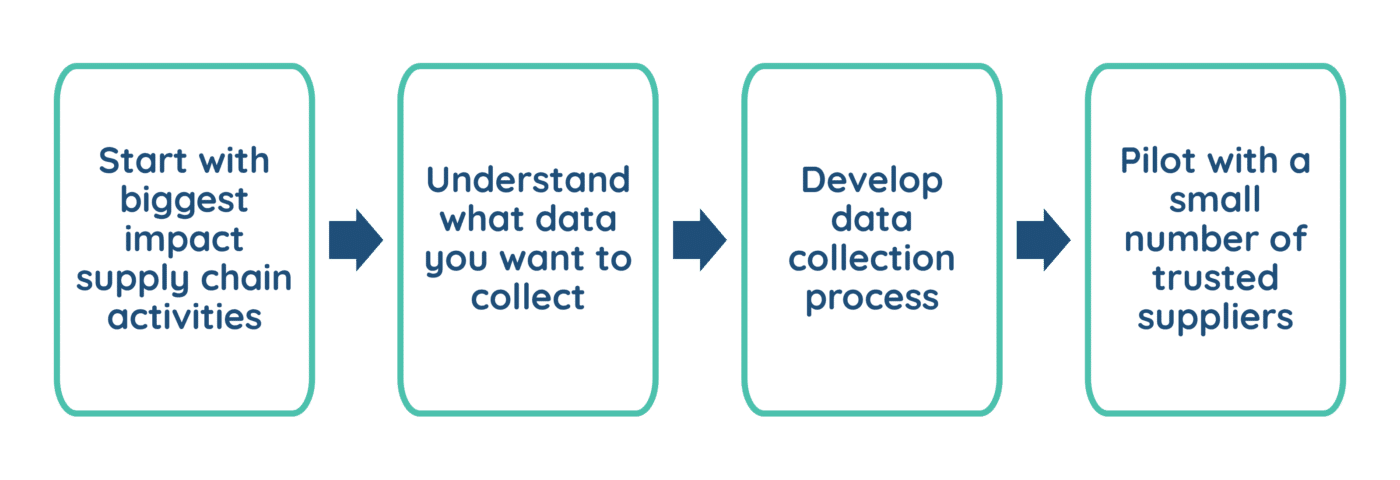
Ultimately, the highest quality Scope 3 data may need to come from the suppliers themselves, but any direct supplier engagement should be approached carefully and strategically. Organisations are rarely able to engage with their entire supply chain all at once, so any efforts should begin with suppliers linked to the largest and most strategically important emissions sources.
When engaging with a supplier, clear communication is essential. Suppliers need to understand exactly what data is being requested and why, and ideally, any requests should be aligned with recognised standards and terminology wherever possible. Starting with a small pilot group of suppliers to test new processes can help refine data collection processes before rolling them out more widely.
Importantly, supplier engagement does not have to be framed purely as a compliance exercise. Collaborative discussions around emissions data and potential hotspots can support shared understanding, highlight efficiency opportunities, and strengthen long term supplier relationships.
Remember to keep the process as simple as possible…
- You don’t need to reinvent the wheel
- Try to align with industry standards and terminology
- Always use straightforward language
- Aim to provide additional guidance & support, where possible
Any Scope 3 improvements are best viewed as a longer term journey rather than a one-off exercise. In the early years, most organisations rely heavily on spend based data, often supplemented by pockets of generic process based information. Over time, as internal systems improve and supplier engagement increases, spend based estimates can be progressively replaced with more specific and actionable data.
As data maturity improves, organisations are better able to track the impact of carbon reduction initiatives, link emissions changes to real operational decisions, and set more credible targets for value chain decarbonisation. The goal is not to eliminate uncertainty entirely, but to ensure that Scope 3 data becomes increasingly robust, transparent, and more useful for informing future actions.
Looking to Improve Your Scope 3 Data Further?
Please use the form below to contact us regarding your carbon footprinting needs.

ISO 14060 Consultation Opens as SBTi Releases Corporate Net Zero Standard v2.0
Two major developments this month indicate continued evolution in the global net zero standards landscape, [...]
Jun

DESNZ Release 2026 UK GHG Conversion Factors
The Department for Energy Security and Net Zero has released the 2026 UK Government Greenhouse [...]
Jun

EU Publishes Framework for Calculating Whole Life Carbon of Buildings
The European Commission has published a new framework for calculating the life cycle global warming [...]
May
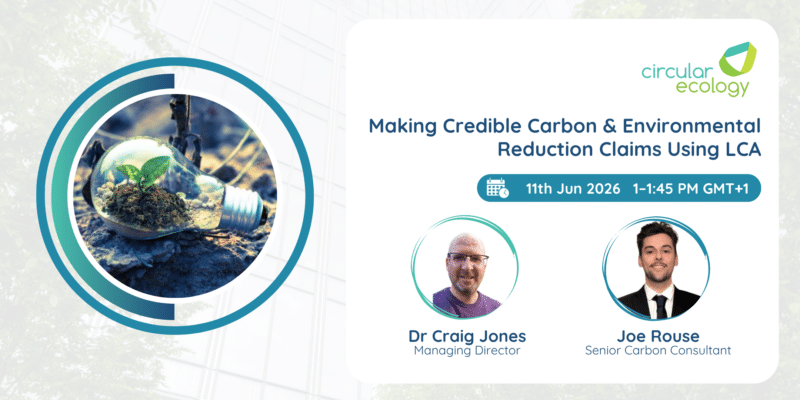
June 2026 Webinar: Making Credible Carbon & Environmental Reduction Claims Using LCA
Our next free webinar takes place on 11th June 2026, and will explore how Product [...]
May