Carbon Footprint, Knowledge Article, Sustainability
The Carbon Emissions of Homeworking and Office Working

Aug
As the world has moved towards hybrid and remote working, Circular Ecology asks the question, what are the carbon emissions of homeworking and office working?
Of course, there are many variables to consider in the answer to that question, and so we will attempt to discuss them in this article. Considerations such as the size of your work or home office, how far you commute, and the transport method you use all influence the emissions of home and office working. Please note that UK specific data has been used within this assessment.
Travelling to Work
The distance travelled to and from the workplace will have an impact on the carbon results of office working. If you are commuting by car, for example, carbon emissions will increase the further you have to commute. In the 2021 Census for England and Wales, data was collected on the distances people travel to work (Office for National Statistics, 2022). The results show that most people who travelled to work, travelled less than 10km. This accounts for a one-way journey, and so this distance should be doubled to account for the travel both to and from the workplace.
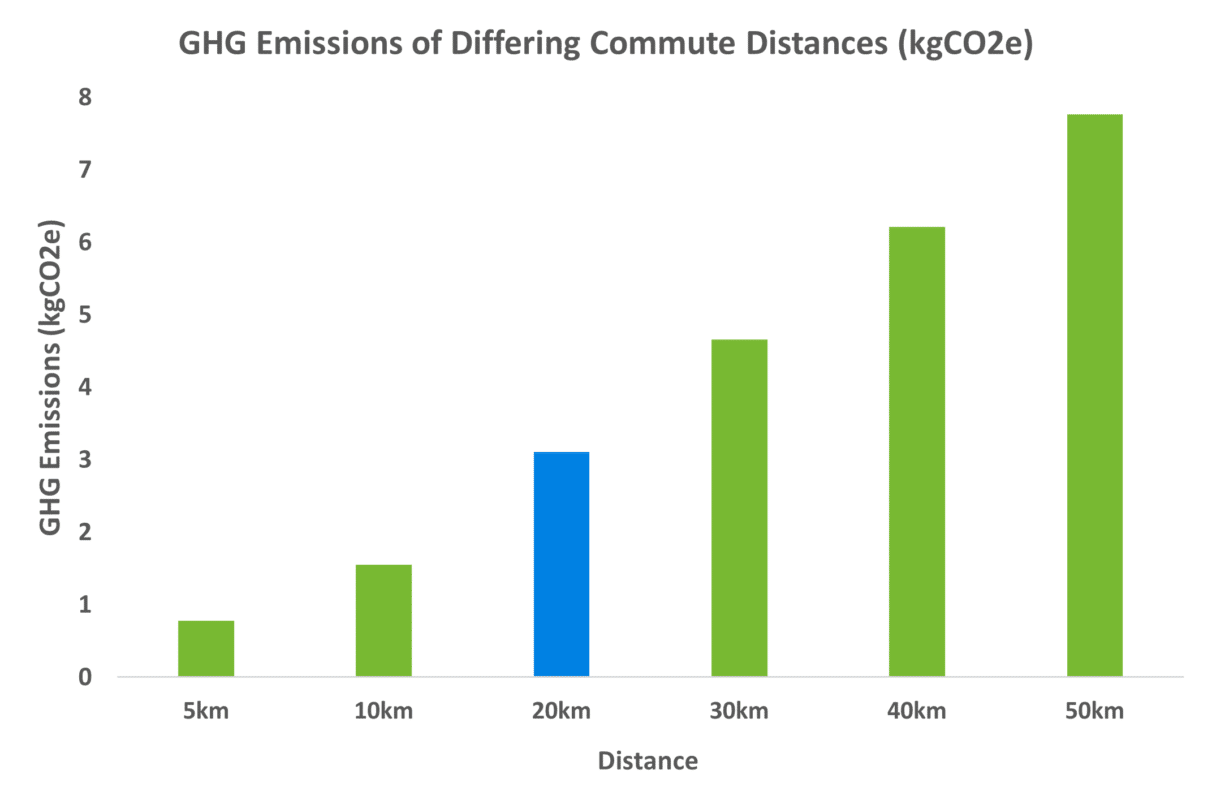
Figure 1 – GHG Emissions of Varying Commutes using Transport Methods Weighted Average
Figure 1 shows the increase in emissions as the overall commute distances get longer. This is calculated using the weighted average emissions factor (shown in blue in Figure 2) derived from the census transport to work results and the DEFRA 2023 conversion factors. The 20km total commuting distance (both to and from work) has been used within this assessment and is highlighted in blue.
It is also necessary to assess how people travel to work. Again, we can look to the data from the ONS to find out how people commute. The most selected mode of transport when travelling to work was “driving a car or van” at 45.1% (Office for National Statistics, 2022). The next highest responses were “on foot” and “by bus, minibus or coach”.
The choice in mode of transport will create differences in the carbon results. For example, walking to work would not generate carbon emissions whereas driving by car would. The fuel type of the car or van can also make a difference in the quantity of emissions. For this article, we will use a weighted average from all the transport methods included in the Census results across all the main fuel types where emissions factors are available from DEFRA. The result of this weighted average is shown in Figure 2 in the blue column, for a 20km total commute.
Figure 2 – GHG Emissions of 20km Commute by Transport Method
Of course, when it comes to homeworking, there is no commute and so no associated carbon value needs to be attributed to this.
Energy Usage
For both home and office working scenarios the energy usage within the workspace will result in carbon emissions. The general setup is similar for both environments, with the need for office equipment and temperature controlling equipment such as central heating. In this respect, the main difference between home and office working is the size and layout of the space occupied.
Office-based working commonly takes place in large open-plan office spaces, for which we will need to attribute a part share of total energy use for this assessment. It is important when calculating an emissions factor for this impact that a view of the full calendar year is considered for an average value. For example, gas usage is likely to be higher in the winter due to increased heating of the workspaces, and electricity may be higher due to the need for more lighting during the working day.
Figure 3 shows the emissions factors for office and homeworking in kgCO2e per hour.
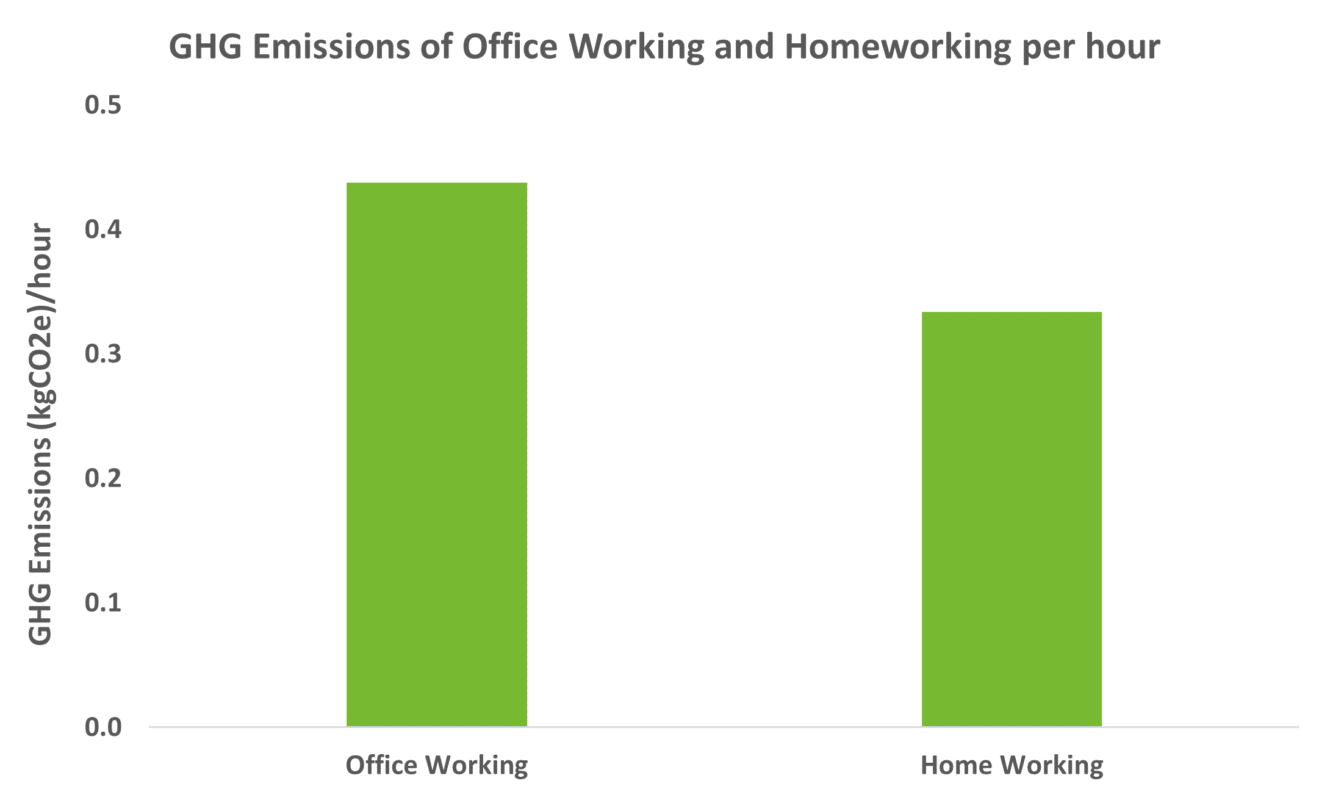
Figure 3 – GHG Emissions of Office and Homeworking per Hour
Homeworking
To establish an emissions factor for homeworking, we can refer to the DEFRA 2023 conversion factors. Defra break this factor down into office equipment and heating. To account for varying heating usage over a calendar year, DEFRA provide an annual average for heating which is estimated using data from “Typical Domestic Consumption Values 2020” (Ofgem 2020).
For the office equipment aspects of the homeworking factor, DEFRA state the following:
“Office equipment is an estimation of energy used by a homeworking employee. GHG conversion factors for electricity consumption come from the UK GHG Conversion factors model outputs for UK Electricity. There are 3 assumptions:
- assumed that a homeworking employee only uses energy for a laptop or PC, monitor, phone, printer, and lighting.
- assumed that the energy used by a homeworking employee is 140W, same as the energy used by a workstation (a laptop or PC, monitor, phone, and printer). Electricity use data for a workstation came from CIBSE Guide F (CIBSE, 2012).
- assumed that the energy used for lighting is 10W per homeworking employee (an assumption by EcoAct).” – (DEFRA 2022)
DEFRA’s combined homeworking emissions factor is provided as 0.33378 kgCO2e per hour per person.
There are several real-world variables that could affect this number such as, the size of the room utilised as a home office, the number of people working from home, and the control of heating in the home. For example, for energy saving purposes some people may switch off certain radiators in their home. Homes can also be differently insulated, and boiler efficiency may also affect the amount of energy used when working from home.
Office working
For the office working emissions factor, a study from the University of Exeter has been used. This study uses benchmark data for “general office” buildings taken from CIBSE TM46 to estimate the energy usage of an office. The study also notes that no adjustments were made to account for building efficiency, which is a significant variable in the energy usage, and that the gas heating efficiency rate was assumed to be 80%.
The office occupancy density was also required to calculate this emissions factor. The study used an occupancy report from JLL Estate Agents as well as data from CIBSE TM46. The data was used to calculate square meterage per person for i) very high, ii) high, iii) average and iv) low density offices. A midpoint of these values was then used for the emissions factor calculation to arrive at a baseline scenario factor.
The baseline scenario calculated the office working emissions to be 3.5 kgCO2e per day per person. A working day was said to be 8 hours and therefore the factor can be stated as 0.4375 kgCO2e per hour per person.
The Carbon Footprint of a Working Week
We must now consider different scenarios for a working week, to calculate and compare carbon results based on a person’s potential working patterns.
Scenario One – Office Working Only
This scenario assumes the following
- 5 days a week commuting to an office and 0 days a week working from home
- A working day is 8 hours in length (a total of 40 hours per week)
- The same commute distance to and from work is travelled everyday
When calculating this scenario, the emissions of travelling to and from the place of work and the energy use at the office are accounted for. The results are broken down as shown in Table 1 below.

Table 1 – Scenario One: Office Working Results
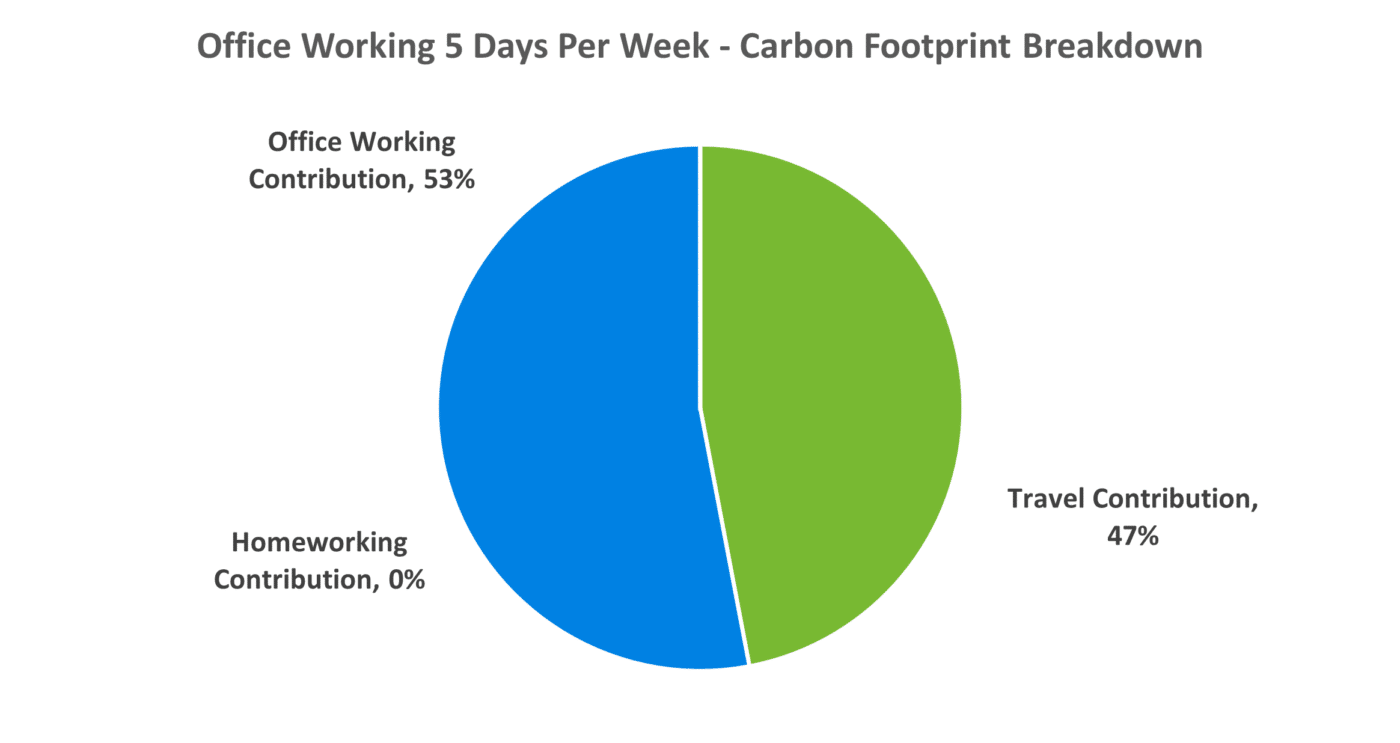
Figure 4 – Scenario One Carbon Footprint Breakdown
Figure 4 shows that the carbon emissions for this scenario’s working week are quite evenly distributed between travel and office energy emissions, at 48% and 52% respectively. The office energy contributes just 4% more to the overall carbon footprint of 33.43 kgCO2e/week.
Scenario Two – Homeworking Only (Fully remote working)
This scenario assumes the following
- 0 days a week commuting to an office and 5 days a week working from home
- A working day is 8 hours in length (a total of 40 hours per week)
- There is no attributed commute to the place of work
When calculating this scenario, only the emissions of energy use from the home office are accounted for, as no travel is required to a place of work. The results are broken down as shown in Table 2 below.

Table 2 – Scenario Two: Homeworking Results
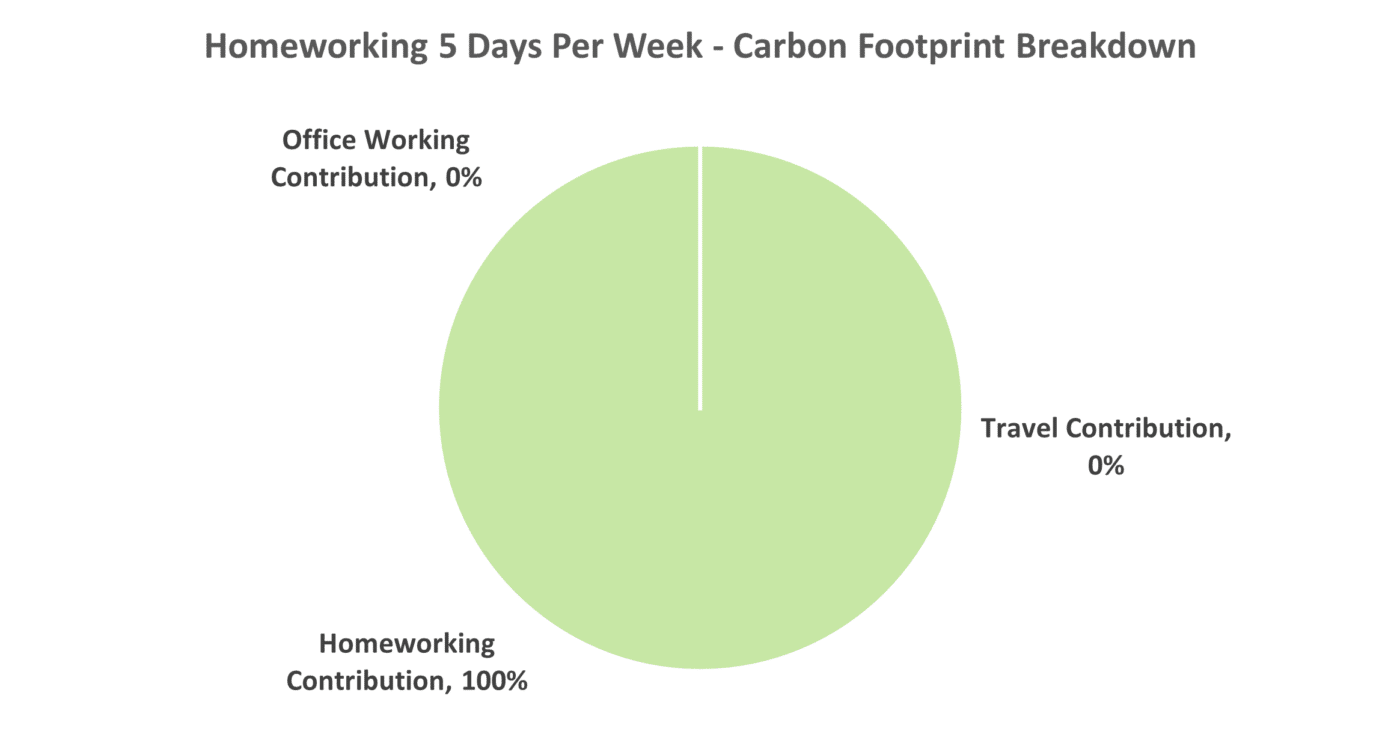
Figure 5 – Scenario Two Carbon Footprint Breakdown
Figure 5 shows that, as expected, the carbon emissions come solely from the homeworking energy use. The overall carbon footprint is 13.63 kgCO2e/week. This is a difference of 19.8 kgCO2e/week compared to a full working week commuting to and working in an office.
Scenario Three – Hybrid Working
This scenario assumes the following
- 2 days a week commuting to an office and 3 days a week working from home
- A working day is 8 hours in length (a total of 40 hours per week)
- The same commute distance to and from work is travelled on office working days
- There is no attributed commute to the place of work for homeworking days
A 2022 survey found that the typical UK worker is going into the office “less than 1.5 days per week” (Advanced Workplace Associates 2022). For scenario 3, using these survey results and taking a conservative approach, it has been assumed that a hybrid working week would consist of 2 days of office working and 3 days of homeworking. The results are broken down as shown in Table 3 below.

Table 3 – Scenario Three: Hybrid Working Results
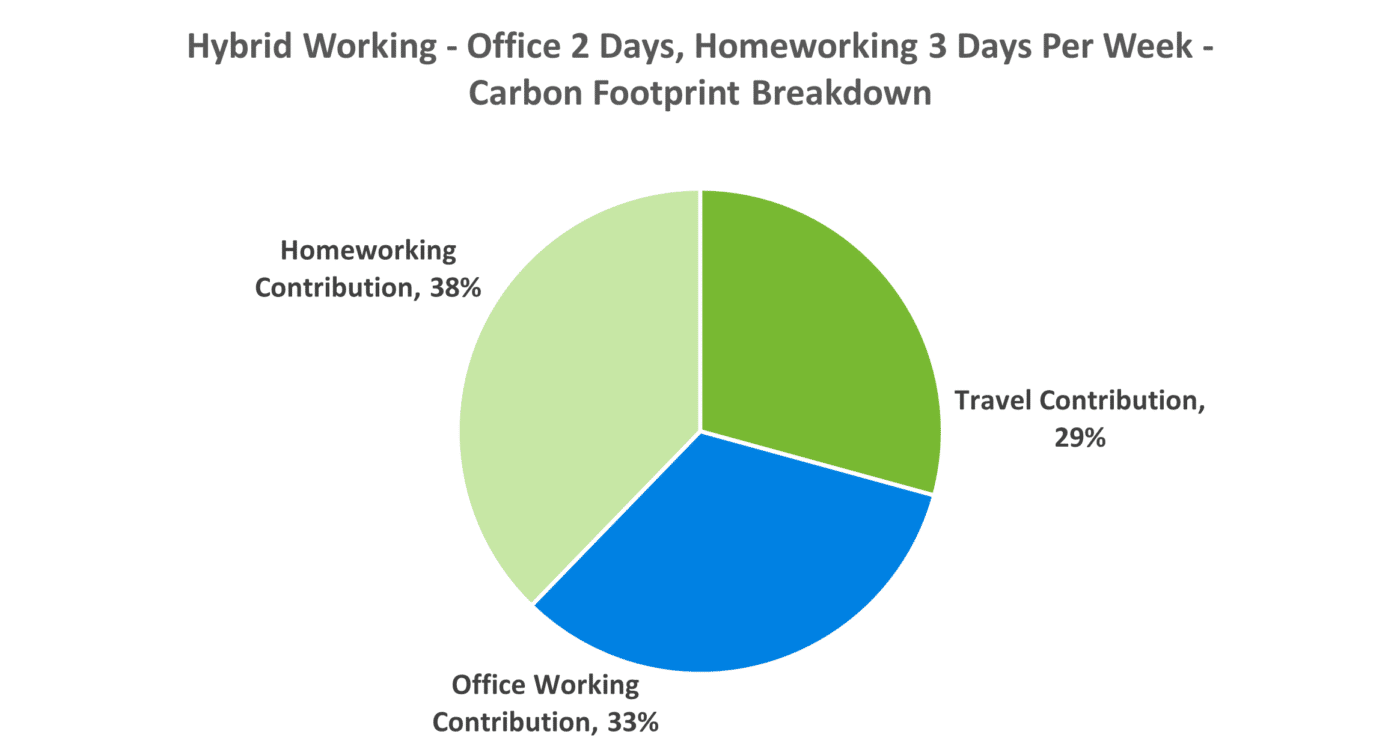
Figure 6 – Scenario Three Carbon Footprint Breakdown
Figure 6 shows that homeworking energy usage contributes the most to the carbon footprint of the hybrid working scenario. This is to be expected as most days of the week are spent working from home in scenario 3. If the travel and office energy use are added together to represent the office working days, this makes up 62% of the hybrid working footprint, despite only being utilised 2 days per week.
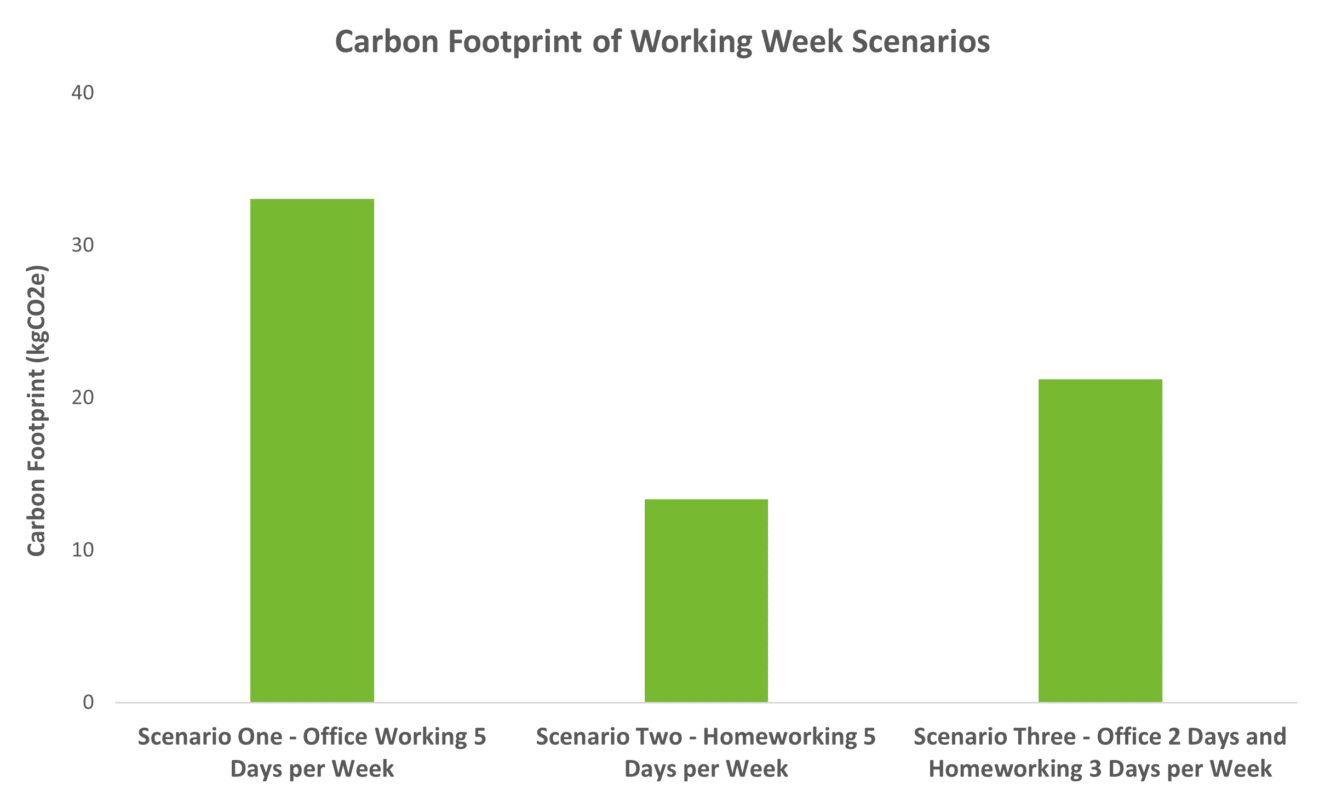
Figure 7 – All Scenarios Carbon Footprint Comparison
Figure 7 shows how each of the scenarios presented might compare across a full working week. However, the reality of every individual’s working situation should be assessed against the assumptions made above before determining the option with the lowest impact.
Minimising the Carbon Footprint of Your Workplace
As our working patterns evolve, there may not be a single perfect option for minimising our workspace carbon impacts, and there are many external factors which may affect choices such as insufficient space, access to services and equipment, or personal preference. But if you are looking to reduce the carbon footprint of your workspace, or of your workforce, there are a few things you can consider for both home and office workspaces.
- Consider a green energy tariff for your home or office building
- Consider commuting via public transport, car share, or even biking or walking to work where feasible
- Be careful not to over-utilise heating or air-conditioning. Consider setting or amending individual controls on heating and radiators so they can be switched off in unused rooms
- Turn off office equipment when not in use overnight, or over the weekend
- Use energy efficient lighting such as LED
- Improve the heating efficiency of your workspace
If you would like to measure and reduce the carbon footprint of your organisation, take a look at our Organisational Carbon Footprint page.
Featured image provided royalty free from Unsplash