PLEASE NOTE: This article is over 4 years old and is due to undergo a review of data currency (including embodied carbon factors, among others).
Embodied Carbon of Solar PV: Here's Why It Must Be Included In Net Zero Carbon Buildings
- Embodied carbon is the carbon footprint to make a product
- Solar PV based electricity is undoubtedly lower carbon emissions than fossil fuel-based electricity
- However, it is also known to have a high embodied carbon footprint, particularly for crystalline PV
- With an increasingly decarbonising grid does the embodied carbon of solar PV now need more attention?
- How does the embodied compare to operational carbon?
- Or is solar PV now the elephant in the room?
- What does this all mean for net zero carbon…
The Carbon Footprint of Solar PV
Embodied carbon is the carbon footprint to make a product. It arises throughout the supply chain and cuts across geographies. It therefore gives us a true picture of the carbon intensity to manufacture a product.
When it comes to Solar Photovoltaics (PV), it is well established that they can have a high embodied carbon footprint. However, this has traditionally been offset by the savings in electricity from the national grid.
Historically the carbon emissions of generating UK electricity have been high. Not too long-ago coal and gas fired power stations dominated the UK fuel mix. That has rapidly changed with the rise of renewables, particularly wind, and biomass which has transformed the carbon footprint of the national grid.
In fact, the carbon footprint of UK electricity has reduced by a massive 45% in just 4 years (2015 to 2019). It also continues to decarbonise and is expected to make a significant contribution to the UKs aspiration to be net zero carbon.
An important question is therefore, in the modern landscape of a rapidly decarbonising grid, is the embodied carbon of PV now something that needs tackling?
How does the embodied carbon compare to operational carbon?
Or is solar PV now the elephant in the room?
With the rise of net zero carbon buildings, this is now a prominent question.
Let’s take a look.
Embodied Carbon of Solar PV
There are many different types of solar PV. Despite this, crystalline PV has been dominant, with over 90% of the market share.
Crystalline PV is can be further separated into mono-crystalline, which has a higher efficiency, and polycrystalline, which has a slightly lower efficiency. For this article, we will take a look at mono-crystalline PV.
Let’s take a closer look at the embodied carbon of PV. Collecting data on the embodied carbon per kWp or per m2 of solar panel, allows us to compare the embodied carbon with carbon savings on a location by location basis. We have used several references on the embodied carbon of mono-crystalline PV [IEA, 2015; ecoinvent V3; M. Ito, 2011]. There are many other references, but we found that most are based upon the same background data and there is a desperate need for more data from producers of PV systems.
The average embodied carbon in those references for monocrystalline PV was 2,560 kg CO2e per kWp. The embodied carbon of all products vary notably, so that should be appreciated with any embodied carbon values.
This now needs to be compared with the amount of energy generated.
Electricity Generation of Solar PV
The amount of electricity generated by solar PV is naturally dependent upon the location and how it has been installed, e.g. orientation, pitch, shading, …etc.
In regards to the UK, the Centre for Alternative Technology (CAT) state that many UK PV systems could be expected to generate 700-900 kWh per kWp. In fact, a well installed system in sunny parts of the south of the UK could generate over 1,000-1,100 kWh per kWp. Outputs therefore vary notably.
The International Energy Association (IEA, 2015), estimate that the average yield of PV in the UK at optimal angle in urban areas is 920 kWh per kWp, which they state is before an annual degradation of electricity generated of 0.7%. However, to remain conservative we will apply a 0.5% degradation factor. This is the annual electricity generation that we will use for the purpose of this article. This means that each year the output of the PV system drops by 0.5%.
Each year the PV system will generate electricity, thereby reducing the load on the national electricity network. This saves carbon emissions each year over the operational lifetime of the system, which is generally taken to be 25-30 years.
So how does this compare with the carbon footprint of UK electricity?
Carbon Emissions of UK Electricity – Grid Decarbonisation
According to Defra’s GHG emissions factors for company reporting for 2019, UK electricity has an all scopes carbon emissions of 0.316 kg CO2e per kWh. What is often not appreciated, is that this is based on the UK’s fuel mixture for 2017. The emissions factors are always 2 years out of date, due to the time it takes to compile the data.
This electricity will also undergo grid decarbonisation over time.
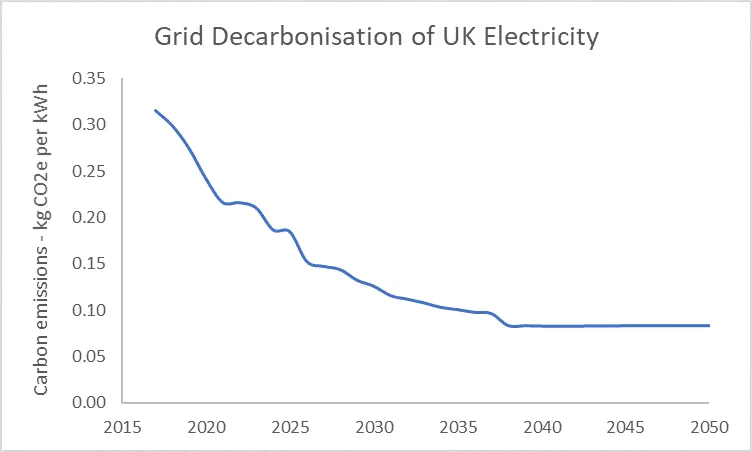
The rate of grid decarbonisation in the future can naturally only be estimated. In order to estimate the rate of grid decarbonisation, data from the National Grid’s Future Energy Scenarios, FES, (National Grid, 2018) on their decarbonisation in 2 degrees scenario has been overlaid with Defra’s GHG emissions factors for company reporting. This scenario has been used here to estimate emissions of electricity generation in the future. It should be appreciated that any scenarios looking into future trends can only ever be an estimate and has an inherent uncertainty.
For clarity, only the emissions from scope 2 were decarbonised. The well to tank emissions were assumed to remain constant to give a conservative approach (however, with an increase in renewables the well to tank emission would be expected to decline over time). This provides the estimated carbon profile of UK electricity below, which has considered the real year of data for the Defra’s GHG emissions factor:
The Significance of Net Zero Carbon
In the UK there has been a considerable rise in interest in net zero carbon developments. The framework definition and method behind what net zero carbon means is still developing and the scope has been left open if the net zero includes just operational carbon or if it also includes the embodied carbon footprint.
We feel that the operational carbon emissions will be expected to be net zero carbon through the use of generating energy from renewables. But that the embodied carbon is more likely to achieve net zero carbon through voluntary carbon offsets.
It therefore presents the case that solar PV is likely to be on the radar of a lot of net zero carbon buildings. It’s a strong technology, has minimal maintenance, low planning condition requirements and a long lifetime.
But what about the embodied carbon?
Let’s see how significant the embodied carbon of PV is, particularly for a building that wants to be net zero CO2.
Significance for an Office Building that wants to be Net Zero Carbon by 2030
Taking the example of an office building. Our data suggest that a typical office could have an embodied carbon of ~600 kg CO2e per m2 floor area. This is for a non-high rise office building.
The CIBSE TM46 benchmarks suggest that a general office consumes around 95 kWh electricity per m2 per year. This compares well to actual energy consumption data on the excellent CarbonBuzz website for office buildings (at the time of writing they had collected data from 134 offices, so a good base).
At the same time, the energy consumption of offices vary and according to the alternative CIBSE ECON 19 benchmarks, the electricity consumption could be as low as 33 kWh per m2 for a naturally ventilated cellular office at good practice, or as high as 358 kWh per m2 for an air conditioned prestige office at typical practise.
The electricity consumption of 95 kWh per m2 per year therefore appears to be a suitable starting point.
To bring the operational electricity (rather than heat load) to net zero carbon through renewables, the main options are typically wind or solar PV. Wind turbines can have many issues with planning conditions, are not suitable for all locations and we can’t just have a country full of wind turbines. A diverse grid mixture is important for energy security and also for balancing the system with an increasing number of renewable with intermittent energy outputs .
It is therefore not inconceivable for net zero carbon developments to consider a large solar installation (or funding part of one). Particularly if they have the available roof space or more likely land to accommodate it.
Let’s take a look at some numbers.
Assuming a 10,000 m2 office. The electricity consumption in this case would be around 950,000 kWh per year. If the building is in a location to achieve 920 kWh per kWp from PV in year one (degrading at 0.5% a year), it would take around a 1,140 kWp PV system size to provide the electricity for 30 years, so a large system. This has considered the annual degradation of output from PV.
Taking an embodied carbon of 2,560 kg CO2e per kWp, this system could have an embodied carbon around 2,920 t CO2e.
The embodied carbon of the office (cradle to constructed), assuming 0.6 tCO2e per m2 and 10,000 m2, could be around 6,000 tCO2e.
Combined with the embodied carbon of the PV system this is 8,920 kg CO2e.
Yes, that’s right, in this scenario the embodied carbon of the solar PV system could add almost 50% to the original embodied carbon of the building. Granted it was for a large PV system, but that is a considerable amount of embodied carbon to add without further consideration and something should be done to manage this.
The example above, provides a good case for including embodied carbon in the definition of net zero carbon, to ensure no carbon leakage occurs.
At this point it’s important to not draw the wrong conclusions but to also look at the significant carbon reduction opportunity that arises.
It should also be noted that the carbon footprint of providing electricity from solar PV is considerably lower than fossil fuels and PV has a long lifetime. However, these details should not exclude it from opportunities to reduce emissions further through managing embodied carbon, especially when there is a significant opportunity.
How does saving 63% embodied carbon sound?
Embodied Carbon V Operational Carbon
The embodied carbon also presents some unfortunate comparisons. The embodied carbon of the PV system was estimated to be around 2,920 t CO2e. Had the building instead used electricity from the UK national grid this could be equal to about 20 years of operational carbon emissions once grid decarbonisation is considered (e.g. for that same quantity of electricity and not including heat of the building). It’s important to note that these estimates are UK only – they do not apply to any other countries.
At the same time, it also presents a paradoxical chicken and egg situation. For the grid to decarbonise we need more renewables, including solar PV.
There will of course be many systems in locations with a better electricity output and therefore improved comparisons. Each case should be compared on its own merits.
For clarity, had grid decarbonisation not been considered, it would be equal to around 12 years of operational carbon emissions for the UK electricity. That approach uses the estimated carbon emission factor per kWh from the year 2020 and applies it for every year in the future. For further clarification the carbon factor from the year 2017, which at the time of writing is the latest actual data from Defra 2019, but in 2020 is 3 years old, it would have been 9 years of operational electricity, again without projecting grid decarbonisation. [Note: we will come back to this article in 2022 to compare what the actual carbon emissions of UK electricity was, which is when the data will be available from the Defra GHG emissions factors.
These multiple figures perhaps show well the challenge of profiling carbon of solar PV over a long timeframe and in a rapidly decarbonising grid.
These are unfortunate comparisons that get ever longer as the grid decarbonises and show well the limitations of attributional based carbon accounting to solar PV.
It also needs to be considered what is the marginal emissions of generating electricity from solar PV. Particularly in a system with growing electricity demand. Those are complex issues worthy of separate articles.
Does Solar PV Payback the Embodied Carbon Emissions?
This article is specific to mono-crystalline PV. There are many other types of PV.
In regards to monocrystalline PV, despite the high embodied carbon, in the UK it does currently save more operational carbon than the embodied carbon of production. However, the embodied carbon is significant.
Whilst solar PV is helping to reduce reliance on fossil fuels, such as coal and gas it will always have favourable carbon payback rates.
At the same time, the marginal emissions in a rapidly decarbonising grid may become increasingly important and complex. With such a rapid rate of decarbonisation, combined with increased demand from electrification and a market where fossil fuels are no longer the default provider of new capacity, what is the marginal supply, what was the electricity technology that was displaced (or more likely mix of technologies)? Add a 25 to 30 year timeline to this debate and it becomes an increasingly complex situation. We can therefore expect the high embodied carbon versus expected carbon savings to attract increased scrutiny.
Despite these complexities, solar PV will be an important technology. It is therefore better to focus on the opportunity for reducing carbon emissions of PV, and there is a considerable opportunity…
Opportunity to Reduce Embodied Carbon Emissions using Solar PV
What does this mean for solar PV? Well solar is an important technology in the transition to a low carbon economy and understandably so. It doesn’t have the same planning restrictions as a wind turbine and there are plenty of buildings new and old with the spare roof space, car park space or land to install the systems (e.g. roof mounted or integrated, car ports, ground mounted systems). The output from solar PV is also typically contrasting to that of a wind turbine, with each needing opposing weather conditions for peak outputs. PV also compares very well to any fossil fuel-based electricity.
The case study above, presents a strong case for including embodied carbon in the definition of net zero carbon and highlights the opportunity for reducing the embodied carbon of PV.
In that regards, it is important to appreciate that there are other types of photovoltaics with a lower embodied carbon – in some cases significantly lower.
According to the IEA (2015) a cadmium-telluride, CdTe, based PV system would have an embodied carbon ~63% lower than a monocrystalline PV system for each kWp (embodied carbon around 867 kgCO2e per kWp). With a slightly lower efficiency it needs a bit more space per kWp.
Going back to the previous example of the 10,000 m2 office, a 63% carbon reduction would have been equal to 1,840 tCO2e saved.
This would be achieved by selecting a CdTe system over a mono-crystalline PV system.
That is a significant saving and placed into context of the embodied carbon of the building is equal to almost 30% of the embodied carbon of the building (before a PV system was included).
Wow, an opportunity to save embodied carbon worth 30% of the building from a single measure.
That places it at the very top of carbon reduction opportunities for that building, but is only realised through looking at embodied carbon impacts of PV.
It should be appreciated that this example was for an aspirational building that wanted to generate all electricity of an office from PV (perhaps due to lower planning permission requirements). This gives a large PV system and is currently a rare situation, but with the rise of net zero carbon buildings may now be considered in many more cases.
For whatever reasons, CdTe based PV haven’t really taken off in the UK, but perhaps it’s time to investigate the feasibility of other types of solar PV. As a side note, the element cadmium is known to be highly toxic. There are studies that show cadmium-telluride is less toxic than the cadmium in isolation. PV laminates are also encapsulated. That said, it offers a good example of why true sustainability is difficult to achieve and requires trade-offs to balance one issue with another.
What Can the Solar Sector Do?
Transparency of embodied carbon: It would also be expected that many PV manufacturers produce lower embodied carbon monocrystalline PV panels. The embodied carbon of any product varies between different producers. However, there is a chronic lack of embodied carbon data from the producers themselves. Considering the size of the solar sector around the world, we would have expected to find some Environmental Product Declarations, such as EN 15804, or detailed life cycle assessments (LCA). Until manufacturers produce detailed embodied carbon footprints of their products, procuring a lower embodied carbon crystalline PV panels becomes a challenge.
Cleaner production: The embodied carbon of monocrystalline may also be expected to improve over time. However, we can only determine that with more transparent data on the embodied carbon impacts. In fact, the IEA (2015) report present significant opportunities for reducing the embodied impacts of producing monocrystalline PV. Hopefully over time these opportunities will be realised.
Diversify PV mix: Around 90% of the PV market is from crystalline PV technologies. This is unfortunately the higher embodied carbon technology. There are other types of PV, including the ~63% embodied carbon saving identified for CdTe. Consider the feasibility of alternative types of PV and don’t discount the embodied carbon, it needs to be considered.
Improve efficiency: An increased PV system efficiency helps when comparing the embodied and operational carbon of PV systems.
Discussion – Implications for PV and Net Zero Carbon
These results are significant and have profound implications for net zero carbon buildings. It brings into question the scope of net zero carbon and presents a strong case for inclusion of embodied carbon. If an organisation is aspiring to be next zero carbon, particularly by 2030, it raises difficult questions for those not including embodied carbon as part of their definition of net zero.
Can we just source lower embodied carbon monocrystalline panels? Perhaps we can, but there is a chronic lack of embodied carbon data published by the manufacturers. In fact, we did not find manufacturer specific data, such as an EN 15804 Environmental Product Declaration (EPD) for solar panels.
It is important to highlight that these results are specific to mono-crystalline PV in the UK. They would not apply to other types of PV, although polycrystalline should have a similar but slightly better result profile. The results certainly do not apply to other countries. Each country should be assessed as its own case. The key parameters are the amount of solar irradiation and how carbon intensive is the electricity network. High irradiation and a carbon intensive electricity supply, e.g. as is the situation in Australia, will naturally give a very different carbon profile. Those offer the ideal application for solar PV.
In the context of the UK, it is clear that the embodied carbon of solar PV is now an important parameter, but a big opportunity. As the UK grid decarbonises the embodied carbon of solar panels will only become even more prominent and the large opportunity of reducing the embodied carbon of solar PV is now important.
The Big Question – What About Wind Turbines?
A natural question is what about wind turbines, do they also have a large embodied carbon?
In short, no they don’t. By our calculations, the embodied carbon of a large wind turbine is equal to around 1 year of carbon saved from the electricity. Over such a short timescale grid decarbonisation is not a factor and questions on marginality are not so prominent.
To raise another pertinent question, aren’t renewables part of the UK’s national grid mix anyway? Which gives rise to the decarbonising electricity grid. Well yes, they are.
Currently solar PV is not a particularly large contributor on a national scale. Between 2015 and 2019 the UK reduced the carbon intensity of electricity by 45% per kWh. This was predominantly driven by wind and biomass, combined with a reduction in reliance on coal.
What Next?
It also leaves some burning questions, will other types of PV take over? Will the market take the opportunity to save over 60% of the embodied carbon, or will crystalline PV clean up its act?
Who knows, for now we know that the embodied carbon of PV needs to be taken seriously and that it also warrants further research.
This should be taken to avoid potential carbon leakage, especially in the context of net zero carbon.
Summary
- Solar PV electricity is considerably better than fossil fuel based electricity
- However, monocrystalline PV has an increasingly notable embodied carbon
- To realise the carbon saving opportunity, there should be more consideration of alternative types of PV, such as CdTe, which could be ~63% lower embodied carbon per kWp than monocrystalline PV
- With crystalline PV making up 90% of the market share, the opportunity to save embodied carbon footprint through other types of PV is large
- Solar PV manufacturers should be producing more embodied carbon footprint and LCA data, which is chronically lacking
- In the context of net zero carbon buildings the embodied carbon of monocrystalline PV could be a significant source of carbon emissions
- It therefore presents an excellent case for inclusion of embodied carbon in the definition of net zero carbon
What do you think? Let us know by sharing this page
Limitations
- The analysis applies to monocrystalline PV
- Polycrystalline PV should have a similar but slightly better result profile given that its embodied carbon is a bit lower
- The results are specific to the UK only. Each country should be assessed as its own case
- There is a small body of unique evidence on the embodied carbon of solar PV. Many studies are referring back to the same data sources for production of the crystalline PV cells.
- Whilst the collected embodied carbon studies were considered good quality, there would be a benefit from more studies from PV manufacturers, which are particularly rare
- Grid decarbonisation rates can only ever be an estimate. However, they could also decarbonise either quicker or slower
- The UK average carbon emissions from electricity is applied, rather than a marginal approach, which would be uncertain to estimate over 30+ years
References and Further Reading
IEA, Life Cycle Assessment of Future Photovoltaic Electricity Production from Residential scale Systems Operated in Europe, 2015. http://www.iea-pvps.org/index.php?id=314&eID=dam_frontend_push&docID=2391
National Grid, 2018. Future Energy Scenarios 2018, “Decarbonisation in Two Degrees”, from Table 3.2, http://fes.nationalgrid.com/fes-document/
Masakazu Ito, 2011. Life Cycle Assessment of PV systems. Available from https://www.intechopen.com/books/crystalline-silicon-properties-and-uses/life-cycle-assessment-of-pv-systems
Comments
Leave your comments below.

Webinar Recap: ICE Insights: Methodological Challenges Behind the Scenes
Circular Ecology hosted the fourth webinar in the ICE Database Insights webinar mini series on [...]
Jun

DESNZ (Defra) 2025 GHG Emissions Factors Released
The UK Department for Energy Security and Net Zero (DESNZ) have just released the 2025 [...]
Jun

Webinar Recap: ICE Insights: Are All EPDs Created Equal?
On Thursday, 22nd May, Circular Ecology hosted the third instalment in the ICE Database Insights [...]
May

Webinar Recap: ICE Insights: ICE Analytical Review Processes
On Wednesday, April 30th, Circular Ecology hosted the second session of our ICE Database Insights [...]
Apr