Carbon Footprint, Carbon Offsetting, Energy
Operational Carbon Reductions Are About to Get a Lot More Challenging
Apr
Are the UK’s operational carbon reductions about to get a lot more challenging? In this article we will explore how the carbon impact of electricity is expected to change over the coming years. Many companies and individuals have relied on a greener National Grid for their operational emission reduction targets. However this is about to change.
Each year the National Grid ESO (Electricity System Operator) releases new data predicting how the grid will change over the coming years in the Future Energy Scenarios (FES) documents. The report breaks down how electricity demand and how the inputs to the grid will change. Additionally, it discusses how supply and demand will be balanced in the run up to the UK governments target of net zero by 2050.
For this article we will focus on one chart in the report, the Future CO2 Intensity of Electricity Generation shown in Figure 1 below.
What does the graph show?
The graph is a simple line chart showing how the National Grid ESO are predicting the carbon impact of 1 kWh of electricity will change up until 2050.
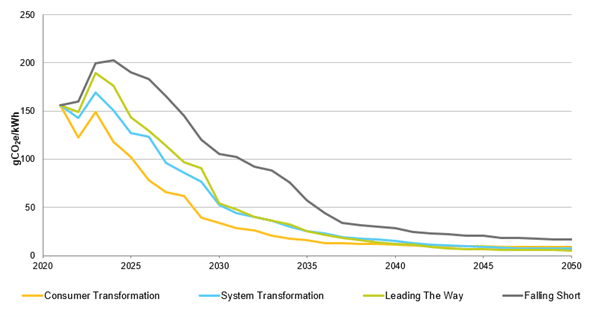
Figure 1: ES.E.10: Future CO2 Intensity of Electricity Generation (gCO2/kWh) without BECCS Source: Future Energy Scenarios 2022
For the purpose of this article, we will focus on the ‘Falling Short’ scenario without the consideration of any stored carbon from bioenergy with carbon capture, use and storage (BECCS) (available in the data workbook accompanying the report). In 2017, the RICS recommended, if grid decarbonisation is to be considered in a whole life carbon assessment, the ‘Slow Progression’ scenario should be used. This was renamed as ‘Steady Progression’ from 2018 to 2021 and ‘Falling Short’ in 2022.
What has this data previously shown?
Before digging into the graph for 2022 let us first have a look at how the intensity of electricity generation has changed throughout the FES yearly reports. The ‘Falling Short’ scenarios since 2017 are plotted in the graph below, with the lighter lines being the older data sets and the darker lines being the newer.
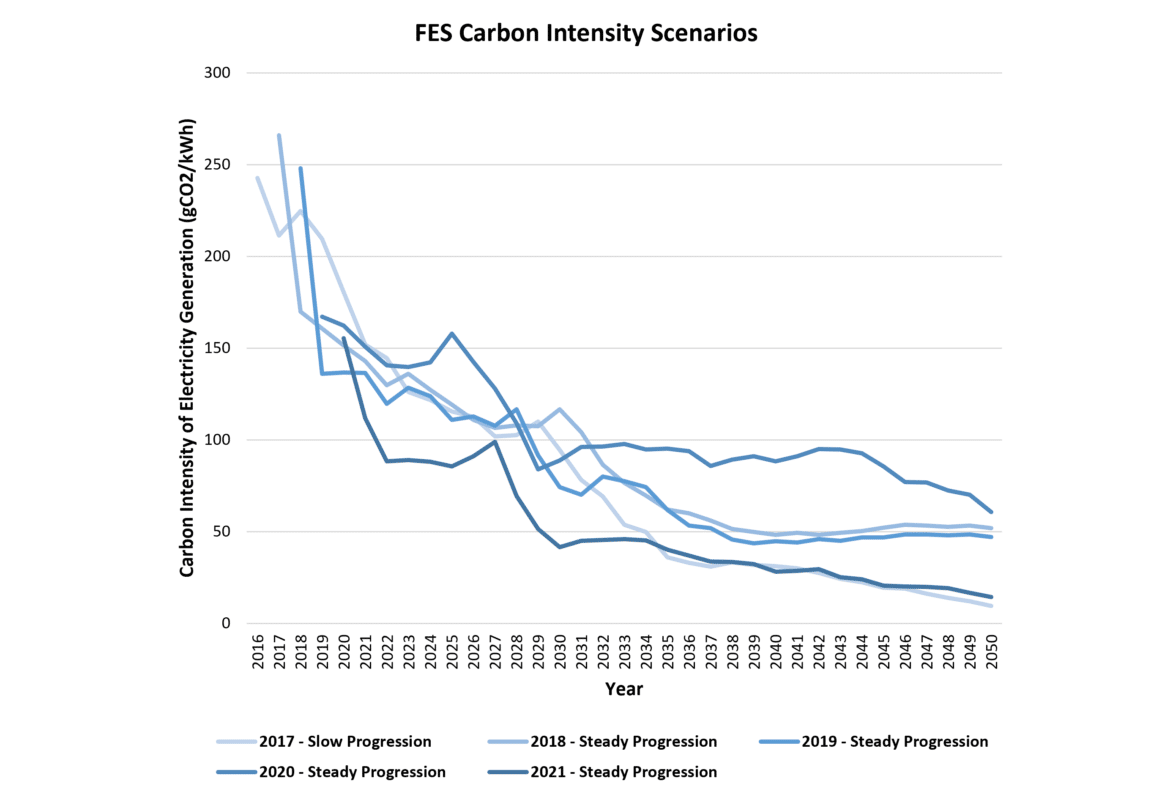
Figure 2: FES Carbon Intensity Scenarios from 2017 to 2021
The graph paints a clear picture; the carbon impact of 1 kwh is expected to reduce considerably over the coming years as we move away from fossil fuels.
This has been great for organisations because their emissions can be reduced passively, through using a cleaner National Grid, without reducing consumption.
In the graph, most of the reduction looks to occur before the early 2030’s with smaller reductions being made in the 2040’s. However, if the perspective of the graph is changed to a logarithmic scale, the trend becomes much straighter. This indicates that the National Grid ESO are predicting a more constant percentage reduction in emissions every year up to 2050. This highlights that year-on-year percentage reductions must be made by the National Grid to continually achieve the targeted reductions.
Figure 3: FES Carbon Intensity Scenarios from 2017 to 2021 on a Logarithmically Scaled Axis
Have we been achieving these reductions so far?
On the other hand, if we compare the Slow Progression scenarios from 2017 to 2021 against the actual National Grid ESO data for those years, we can see how well the National Grid have been doing at reducing their emissions in line with expectations.
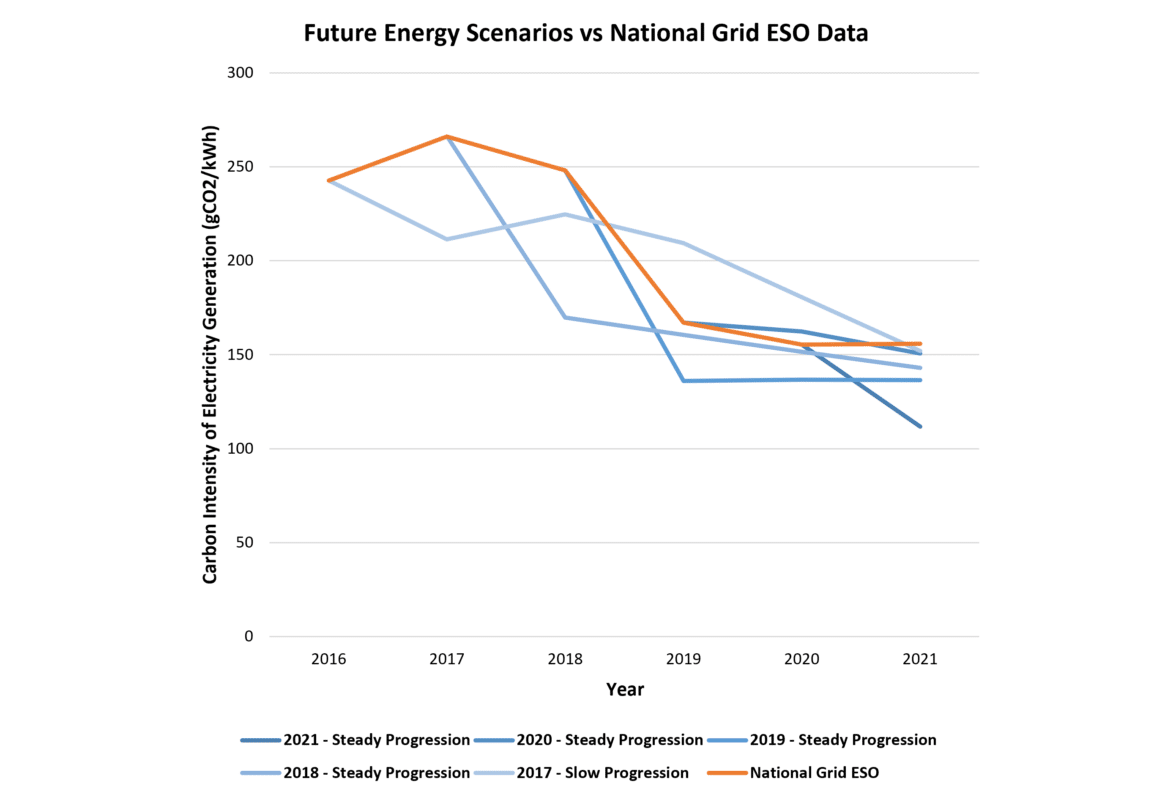
Figure 4: FES Steady Progression Carbon Intensity Scenarios compared to actual National Grid ESO Data
From 2017 to 2021 there was a reduction of over 100 gCO2/kWh, around a 40% decrease! However, as the previous logarithmic graph (Figure 3) has shown, these percentage reductions will need to be maintained in order to achieve the low carbon intensity predicted for 2050.
Note that the scenarios typically overestimate the reductions that will be made in the first year. While the gradient of the lines are fairly constant, 4 out of the 5 scenarios didn’t achieve their first-year reduction estimates and all were predicting a cleaner grid than the 2021 data suggests.
What does the graph show in 2022?
If we look at the 2022 Falling Short scenario, we can see a clear difference. Instead of the typical big reductions in the first few years, the National Grid ESO are now predicting the carbon impact of 1 kWh of electricity will rise until 2024. It’s not predicted to come back down to current levels until 2028.
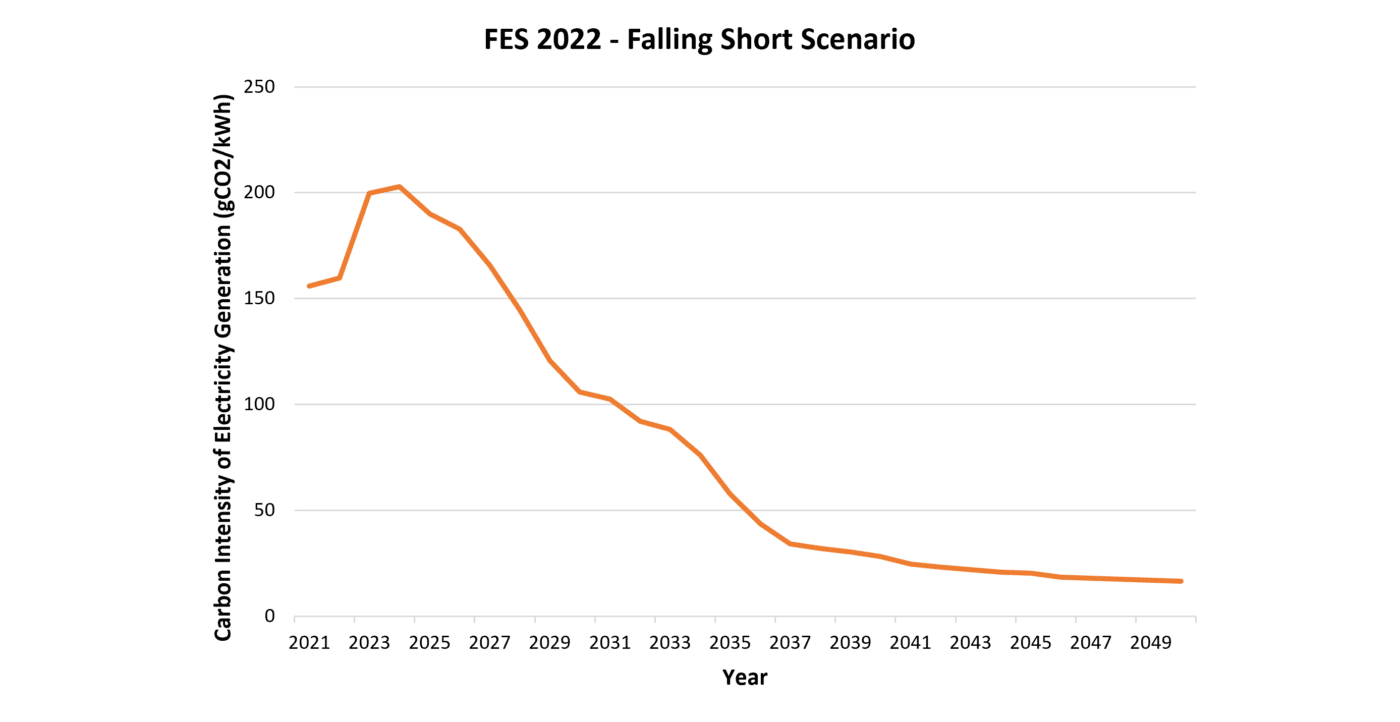
Figure 5: FES 2022 Falling Short Scenario
This means reductions in carbon intensity will be delayed by almost 6 years! Carbon intensity will not come back into line with the previous FES predictions until the mid-2030’s. This will have a huge effect on the UK’s carbon emissions over the coming years and makes net zero targets that much harder to achieve.
What are the implications?
Going back to a logarithmically scaled graph (Figure 6), we can see how much harder the challenge to decarbonise has become. Notice how the gradient of the orange line, the 2022 falling short scenario, is much steeper than previous predictions after 2027. This means that the national grid will need to make much bigger percentage reductions each and every year to stay on track.
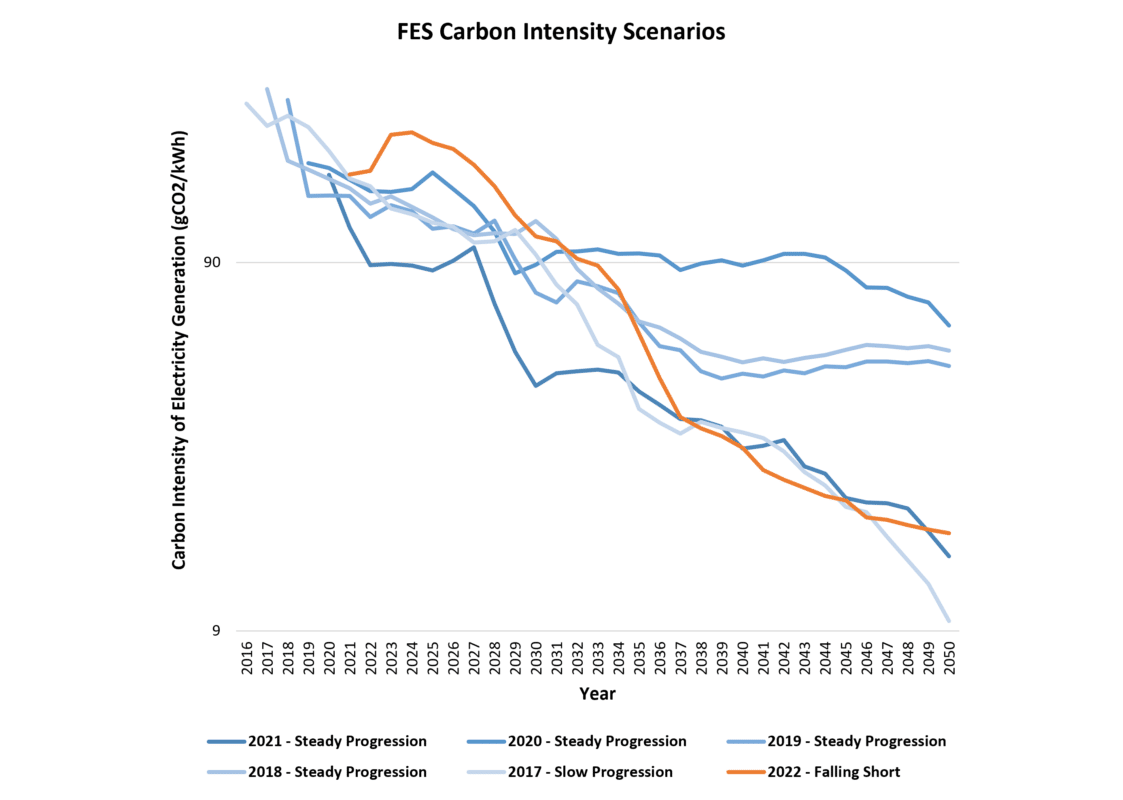
Figure 6: FES Carbon Intensity Scenarios from 2017 to 2022 on a Logarithmically Scaled Axis
This has implications beyond just the National Grid. As mentioned, many companies are relying on cleaner electricity to reach their carbon reduction goals and targets. Without drastically cutting consumption it’s unlikely that these can or will be made.
What are the reasons for this change?
A paragraph from the 2022 FES report summarises why these changes have occurred:
“In recent years, decarbonisation has been the main driver for future change to the electricity system. Over the past year, it has been joined by an urgent effort to improve energy security and reduce energy costs for consumers by reducing exposure to the wholesale gas price. In simple terms, the wholesale cost of natural gas often sets Britain’s marginal electricity price because of the role natural gas generation plays as the marginal generator. Natural gas prices, and therefore electricity prices, have increased rapidly due to demand exceeding supply following the COVID-19 pandemic and the global response to Russia’s invasion of Ukraine. While transitioning from generation that relies on imported fossil fuels to domestic renewables significantly improves future energy security, reduces carbon emissions and reduces exposure to global gas prices, there are also things we can do to reduce demand today.”
What can you do?
This change will come as a reality check for most Reducing your carbon impact comes from either reducing energy consumption, using cleaner energy or offsetting. Whilst this is a setback, it should provide a good incentive for improving energy efficiency and reducing consumption.
If you are interested in how this will affect your company’s carbon reduction plans and targets, please get in touch.