Carbon Footprint, Case Studies
The Carbon Footprint of a Garden Exhibition: Chelsea Flower Show
May
What’s the carbon footprint of a garden exhibition? Where are the carbon hotspots? We address these questions through a case study on last year’s Chelsea Flower Show. Circular Ecology worked with MEDITE SMARTPLY and its multi-award winning “Building the Future” garden, to undertake an innovative assessment of the installation’s carbon footprint.
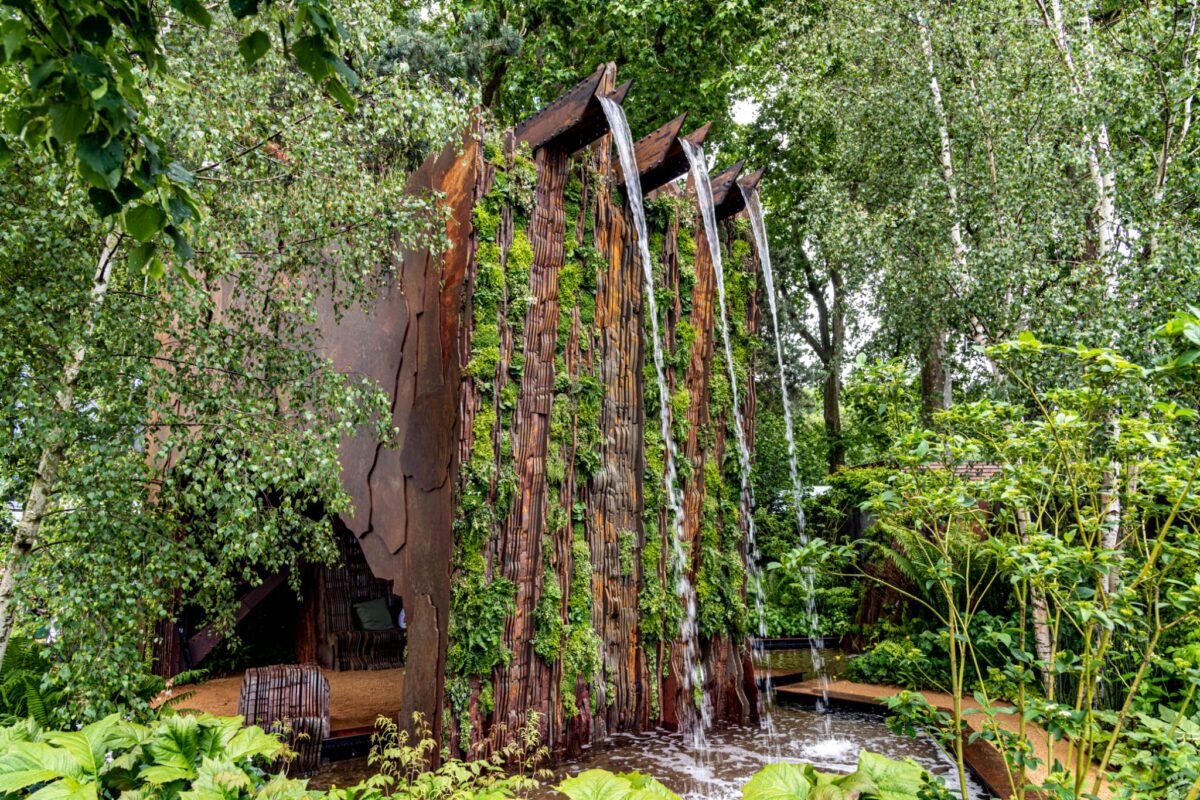
The headline installation showcased some of MEDITE SMARTPLY’s sustainable and innovative wood-based panel products in the garden, which was themed around sustainability and the multiple applications and versatility of their products, including outdoors! A year on from the May 2022 show, we can now look back at the installation’s whole life carbon footprint and provide some interesting insights into the garden’s carbon hotspots. We hope this innovative work encourages other designers to think about the environmental consequences of exhibitions.
Aims of the Study
- To provide an overview of the carbon footprint associated with a garden installation to help inform future shows of carbon hotspots.
- Quantify the carbon storage of wood-based construction products used in the garden, as well as the carbon storage of the garden’s plants & trees.
- Explore and compare post-show options for reuse of materials and plants vs. other end-of life options such as landfill.
- Determine a typical “carbon balance” for the garden installation with consideration for potential longer-term carbon storage.
Carbon Footprint of the MEDITE SMARTPLY “Building the Future” garden at Chelsea Flower Show
To provide insights into the carbon footprint of a typical garden show event, we can start by looking at the carbon impacts across its typical lifecycle stages, from the cradle to the grave. This includes:
- Raw material production – construction and packaging: the embodied carbon of the materials used to construct the exhibition, including MEDITE SMARTPLYs products: MEDITE TRICOYA EXTREME (MTX), SMARTPLY STRONGDECK, SMARTPLY SITE PROTECT PLUS
- Raw materials – plants and trees: The carbon emissions from horticulture, to grow and provide the plants and trees used in the garden exhibition
- Transport of materials to the show
- Transport of equipment and team to and from the show
- Construction and deconstruction energy
- Energy use during the exhibition
- Post show transport and end of life scenario
The carbon profile of the garden exhibition is shown below:
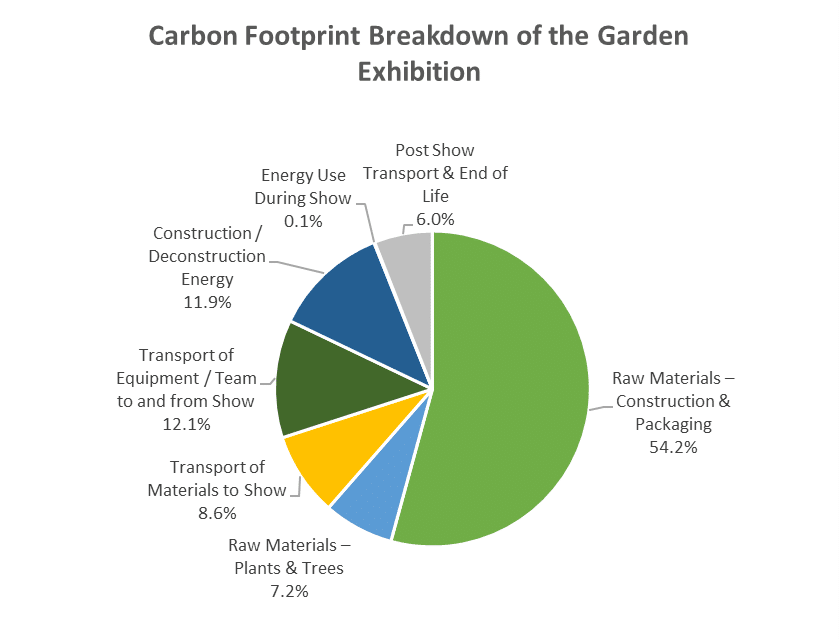
Figure 1 – Breakdown of Upfront Carbon Impacts by Event Stage
As can be seen from figure 1 above, the embodied carbon from the installation’s construction materials and packaging (54.2%) accounts for the largest share of the carbon footprint. Interestingly, transport of the garden team’s and equipment (12.1%) is slightly higher than the transport of materials to the show (8.6%), although it should be noted the full duration of the show was over 3 weeks in total when also considering the construction and deconstruction of the garden and so wide-ranging spectrum of teams and journeys are captured by this figure over the different phases of the show.
Finally, it is worth noting the relatively small contribution from Energy Use during the show (0.1%) to the overall footprint, which can be attributed to the confirmed use of green electricity sources for all mains electricity use, when compared the larger impacts from Construction & Deconstruction energy (11.9%) which mainly utilised fossil fuels such as gas oil (for machinery) which have a much higher overall carbon contribution.
Table 1 below shows the relative carbon impacts of each stage of the process, covering the embodied carbon of raw materials used, as well as the transport and energy utilised during the installation’s construction, in-show maintenance, and post-show deconstruction stages.
Table 1 – Breakdown of carbon by Installation stage (excluding sequestered carbon)
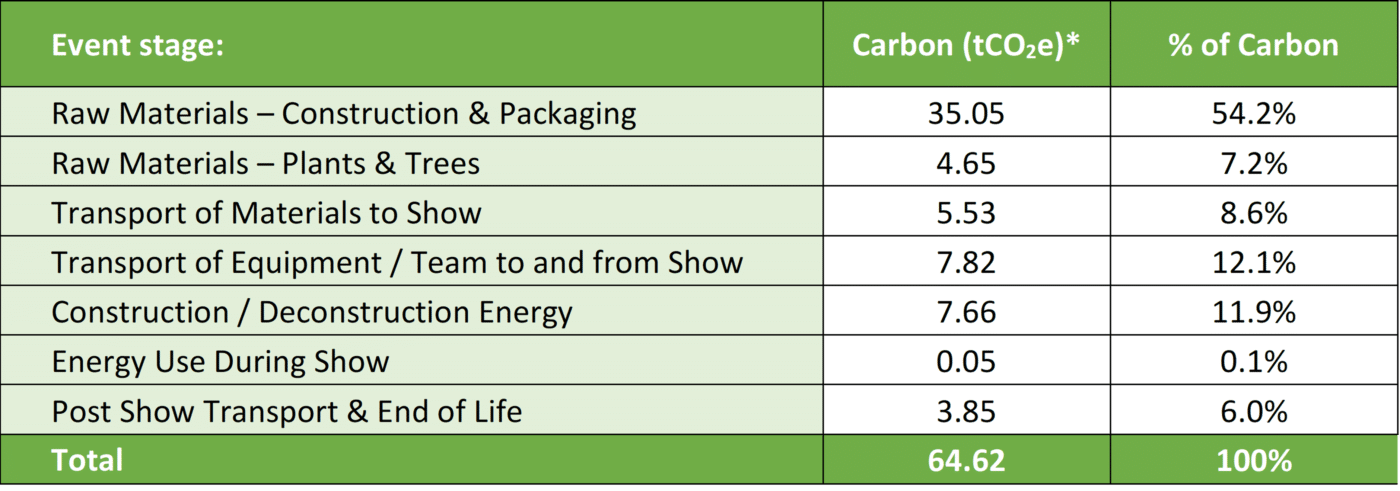
The final stage also considers post-show transport and end-of-life treatment of the garden’s structures and plants, which will be explored further within this case study. For the purpose of the results in table 1, it has been assumed that the majority of structural materials and trees & plants have been reused or reutilised within new installations following last year’s show. Carbon storage within plants and materials has also not been included in table 1 but is further explored separately later within this study.
Carbon Storage within the Exhibition
Having considered the overall impacts from carbon emissions released during the different stages of the garden show, it is also beneficial to assess the potential positive contributions from carbon storage within the installation’s wood-based materials, as well as from its plants & trees.
It’s well established that timber-based materials sequester carbon. Around 50% of the dry weight of timber is Carbon (C), which for sustainably sourced timber can arise as a carbon benefit, given that it is stored within the matter of the timber material.
Table 2 below shows the contributions of carbon storage within the garden installation, from both its wood-based construction materials as well as from the garden’s trees & plants. It should be noted the carbon storage figures shown for trees & plants relate to their estimated carbon storage based on their age and size at the time of the show. Estimations of additional carbon storage of these plants & trees over their full expected lifetime is discussed later on in this study.
Table 2 – Carbon Sequestrations from Materials & Plants
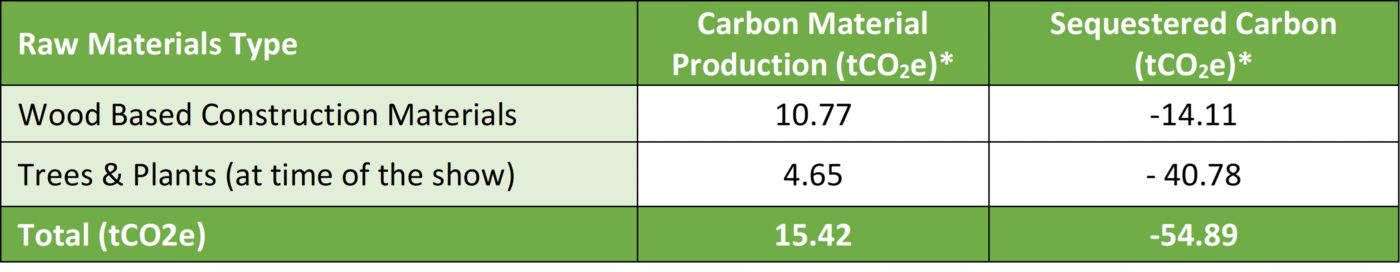
*Carbon emissions are measured in tCO2e, which is the tonnes of Carbon Dioxide equivalent. There are a basket of greenhouse gases, such as methane and N2O, each with different levels of potency which is estimated as “Carbon Dioxide equivalents, tCO2e”
Figure 2 provides a further breakdown of the relative carbon storage contributions from each material and plant type compared to the carbon emissions they release as a result of their production or growth in preparation for the show.
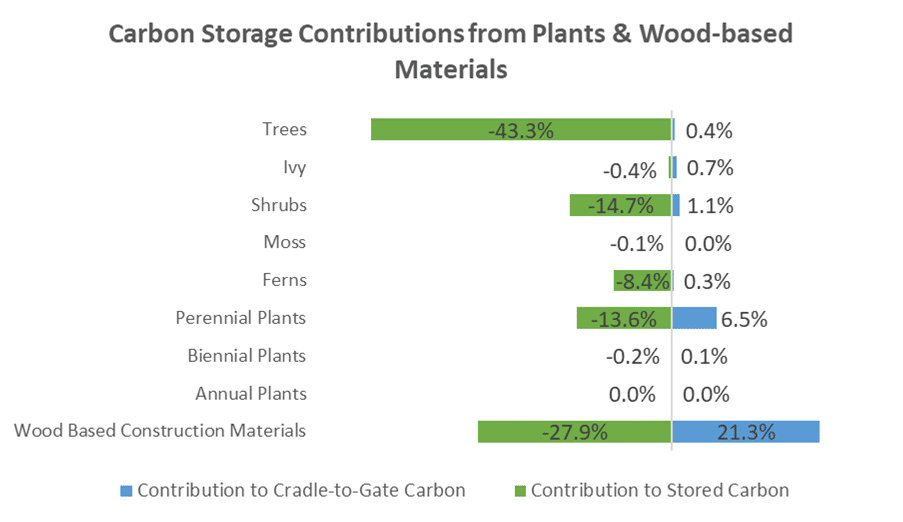
Figure 2 – Breakdown of relative carbon storage contributions from plants and materials
It was particularly interesting to see how much carbon was sequestered within the plants and trees from the exhibition. These also contain carbon within their matter, which is a carbon sink. It was estimated that almost 41 tCO2e would be sequestered within the plants and trees used for the exhibition. This would be increased further through the lifetime of the plants and trees, until the end of their lives. On that topic, the majority of the plants and trees were transported to use on other projects, so that they may continue sequestering carbon for a longer period of time.
End of Life Scenarios
What can be learnt from potential end of life scenarios? Taking a more detailed look at the final stage of the event, we can compare the possible differing carbon impacts associated with different end-of-life options for the installation’s plants and materials.
Table 3 below compares the possible resulting carbon impacts for end-of-life considering the scenario in which i) the majority of plants and materials from the installation are reused or reutilised within a new installation post-show, or ii) the plants and materials are disposed of in landfill post-show.
Table 3 – Comparison of End-of-life Scenarios
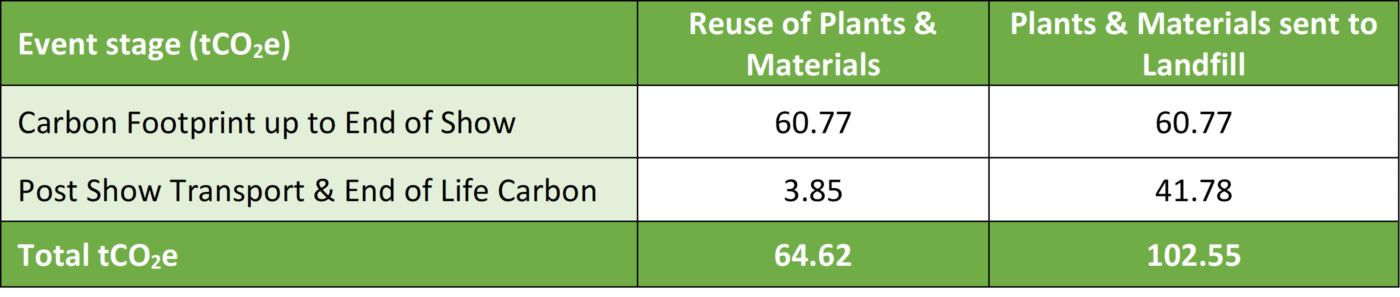
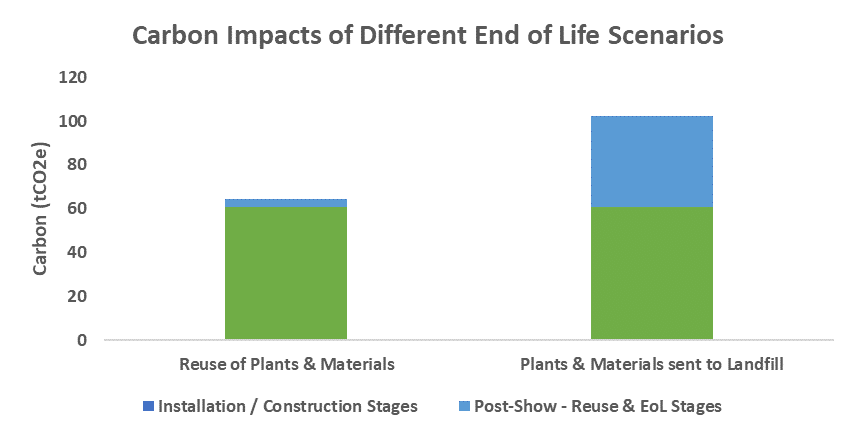
Figure 3 – Comparison of carbon impacts of different end-of-life scenarios
Figure 3 clearly shows the reduced carbon impacts of reusing the installation’s plants and structural materials, when compared to these items being sent to landfill. By extending the life of the items by reusing them, the emissions related to end-of-life and the re-release of any stored carbon can be postponed. The only source of emissions from the reuse scenario refer to the emissions associated with the transport of these items to their final place of reuse. After the Chelsea Flower show, MEDITE SMARTPLY arranged for the structural materials to be deconstructed and delivered to an environmental charity for material reuse. The trees and plants were also used in further projects.
Reuse of the plants & trees also has the additional benefit of allowing these plants to reach full maturity which in turn would increase their potential for carbon storage further based on their expected lifespan and future growth.
However, it should be noted that all sequestered carbon should be deemed to be re-released at end-of-life eventually and so the benefit associated with reuse relates to the extension of life and the postponement of the re-release of any stored carbon.
Overall Carbon Profile of the Garden
By combining all the aspects discussed above, we can take a look at a potential final carbon balance for the garden installation in Table 4 below, should it utilise all the best-case scenarios mentioned.
Table 4 – Overall carbon balance at time of show and by End-of-Life

These results show that the project could sequester more carbon than was released for the construction, transport, use and end of life stages, so long as the construction materials, plants and trees are reused. The additional carbon sequestered over the lifetime of the plants and trees, when replanted in a new home, provides a welcome carbon benefit to the results.
Summary – How Can a Garden Exhibition Reduce Their Carbon Footprint
These case study results reveal a carbon profile, that future garden exhibitions and shows could learn from, to reduce their own emissions:
- Minimise the embodied carbon of construction materials: The embodied carbon of materials was a carbon hotspot. Choose natural materials, such as timber, where possible.
- Re-use materials: At the end of the show arrange for the core installation materials to be deconstructed and sent for reuse, or at a minimum recycling. This results in notable carbon savings and is a particular benefit for timber, which keep the carbon sequestrated in the wooden products.
- Re-use the plants and trees: The plants and trees sequestered notable carbon within them. At the end of the show, transporting the plants and trees to a new home, which results in welcome carbon savings. This also continues their carbon sequestration, through the lifetime of the plants and trees.
- Green energy: This case study had little impact during the show, because of the use of green electricity for the duration of the show (read what the Chelsea Flower show did for their operational energy, where the RHS states that they use biofuel generators and the mains power is from renewables).
For more interesting sustainability articles and case studies of our work, sign up to our monthly newsletter.
Featured Image Credit: George Graham